Startup KPIs: The Essential Metrics by Growth Stage (2026)
93% of failed startups have one thing in common: they measure the wrong things at the wrong time. Without metrics, you can't make decisions. With the wrong metrics, you make catastrophic ones. KPIs (Key Performance Indicators) are your startup's instrument panel. They tell you whether you're accelerating in the right direction or hurtling toward a wall at 200 km/h. But here's what no one tells you: the KPIs that matter at pre-seed aren't the ones that matter at Series A. A business angel looks at your user engagement. A Series A VC wants to see your LTV/CAC ratio and your unit economics. This guide is the first in France to map out precisely which KPIs to track at each funding stage, with the benchmarks French investors actually use to assess your case.
What is a KPI for a startup?
A KPI is a number that triggers an action. Not a number you glance at passively in a Google Sheet on Friday evening. If the number goes up or down and you change nothing, it isn't a KPI. It's decoration.
For a startup, KPIs serve three purposes: validating your business assumptions, convincing your investors that you're on the right trajectory, and aligning your team around what really matters. Everything else is noise.
KPI vs metric: what's the difference?
The confusion is everywhere. The number of visitors to your site is a metric. The conversion rate of those visitors into active users is a KPI. The difference? A KPI is directly tied to a business objective and tells you what to do.
In concrete terms:
| Metric | KPI | |
|---|---|---|
| Definition | A measured data point | An indicator tied to a strategic objective |
| Example | Number of page views | Landing page conversion rate |
| Action | None in itself | A direct decision (optimize, pivot, invest) |
| Volume | Dozens | 3 to 5 maximum per stage |
Vanity metrics are the classic trap. 50,000 followers on LinkedIn. 10,000 downloads of your app. These numbers flatter the ego but say nothing about the health of your business. A seasoned investor dismisses them in 3 seconds.
Why KPIs change with the stage
Because your startup isn't the same company at pre-seed and at Series A. At pre-seed, you're looking for a problem worth solving. At seed, you're validating that your solution works and that people are willing to pay for it. At Series A, you're proving that your model can scale.
Tracking your ARR when you don't have any customers yet is like measuring the top speed of a car with no engine. Tracking only your user engagement when you're raising 5M euros is like showing up to an investor meeting without the numbers they expect.
The rule is simple: your KPIs should reflect the question you're currently solving. And that question changes every 12 to 18 months.
The universal KPIs (across every stage)
Some indicators cut across every stage. Not because they're always the top priority, but because an investor will expect you to know them regardless of your maturity. Here are the five essentials.

MRR / ARR (Monthly & Annual Recurring Revenue)
MRR (Monthly Recurring Revenue) is your monthly recurring revenue. ARR (Annual Recurring Revenue) is MRR multiplied by 12. For a SaaS, it's the company's pulse. It goes up: you're growing. It stalls: you have a problem. It drops: you're in danger.
Formula:
- MRR = the sum of all active subscriptions for the month
- ARR = MRR x 12
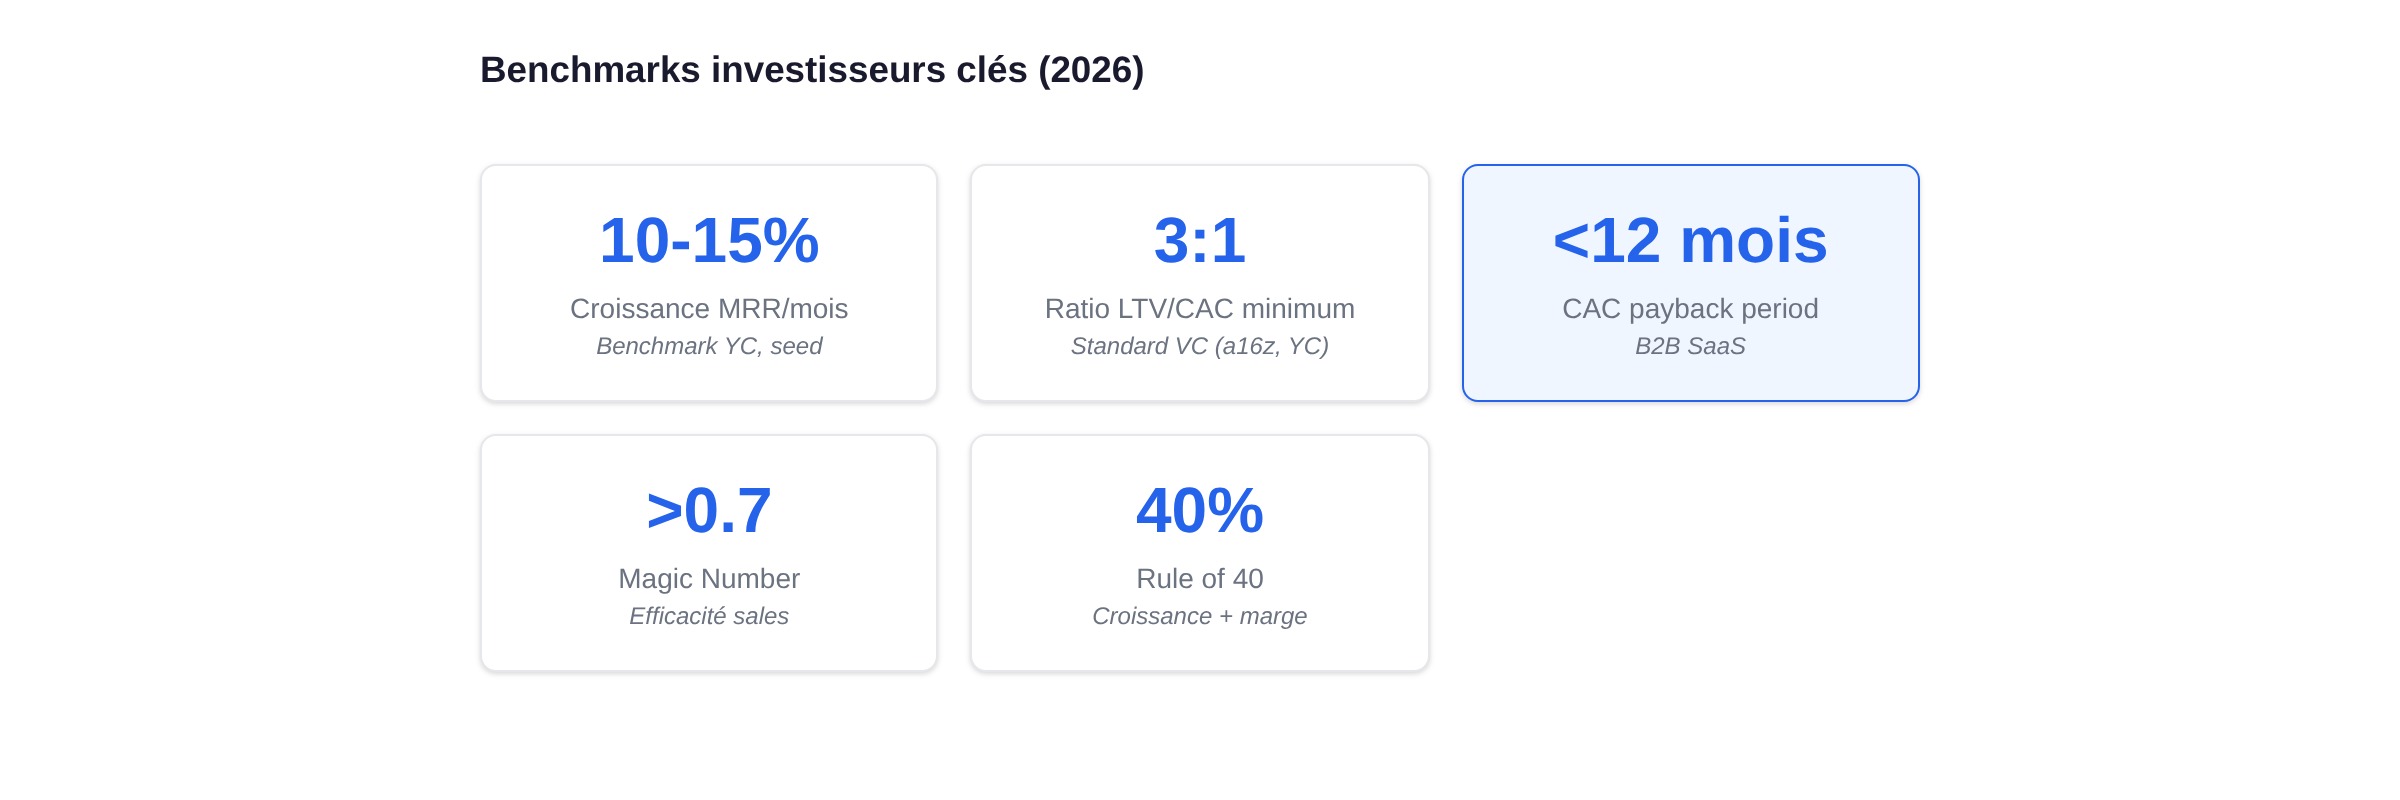
The benchmarks that matter in 2026: Y Combinator considers MRR growth of 10 to 15% per month to be the signal of solid product-market fit at the seed stage. Top-quartile SaaS startups (between 1M and 5M in ARR) show a median annual growth of 52 to 59%. If you're below that, it isn't a disaster, but it's a signal worth investigating.
One thing founders often forget: break down your MRR. New MRR (new customers), Expansion MRR (upsell, cross-sell), Contraction MRR (downgrades), and Churned MRR (lost customers) tell a far richer story than the headline figure. You can have MRR growing 8% a month while losing 30% of your existing customers, simply because your new customers make up the difference. That isn't growth. It's a house of cards.
CAC (Customer Acquisition Cost)
CAC measures how much you spend to acquire a customer. It's the indicator that separates profitable startups from startups that burn cash without understanding why.
Formula:
- CAC = (marketing spend + sales spend) / number of new customers acquired over the period
Watch out for the pitfalls in the calculation. Are you including your sales team's salaries? Your marketing tools? The time the founder spends running demos? An "official" CAC that leaves out 60% of the real costs is accounting fiction. Investors know it.
The reference benchmark: a CAC payback period (the time needed to recoup the cost of acquiring a customer) under 12 months is considered good for a B2B SaaS. Beyond 18 months, you're financing the acquisition of customers you haven't yet made profitable.
To dig deeper into cost-controlled acquisition strategies, check out our guide to growth marketing.
LTV (Lifetime Value) and the LTV/CAC ratio
LTV (Lifetime Value) estimates the total revenue a customer generates over the entire course of their relationship with your company. It's the counterpart to CAC: how much a customer earns you versus how much they cost you.
Simplified formula:
- LTV = ARPA (average revenue per account) x average customer lifetime
- Or for a SaaS: LTV = ARPA / monthly churn rate
The LTV/CAC ratio is perhaps the KPI most closely scrutinized by VCs. The rule of thumb, popularized by a16z and Y Combinator: a minimum ratio of 3:1. Every euro invested in acquisition should bring back at least 3 euros of revenue over the customer's lifetime. High-growth startups aim for a ratio of 3 to 5x.
Below 3:1, your business model doesn't hold up. You're losing money on every customer acquired, or you're not making enough to fund your growth. Above 5:1, it may be a sign that you're underinvesting in acquisition and leaving market share to your competitors.
Churn Rate
Churn is the percentage of customers you lose over a given period. It's the hole in the bucket. You can pour in as much water as you want (acquisition), but if the bucket leaks (churn), you'll never fill it.
Formula:
- Monthly churn = (customers lost during the month / customers at the start of the month) x 100
The B2B SaaS benchmarks in 2026:
- Mid-market / Enterprise: monthly churn below 1% (so under 12% annually)
- SMB (small businesses): annual churn of 5 to 7% for the best performers, which is ambitious
- Early-stage: annual churn of 10 to 15% in the first year is common and shouldn't alarm you too much, provided it decreases quarter after quarter
Net revenue churn (which factors in expansion revenue) is even more telling. If your existing customers spend more (upsell, adding seats), you can have negative churn: your remaining customers bring in more than what you lose on departing ones. That's the holy grail of SaaS.
Runway and burn rate
Runway is the number of months you have left before you can no longer pay your salaries. Burn rate is the speed at which you consume your cash each month.
Formulas:
- Monthly burn rate = total monthly expenses - monthly revenue
- Runway = available cash / monthly burn rate
In France, the median runway at the time of a fundraise is around 6 months. That's too short. A runway of 12 to 18 months gives you the room to negotiate calmly with investors. Below 6 months, you're in a weak position, and VCs can sense it.
Practical tip: calculate your runway every week, not every month. Nasty surprises come fast when you're paying salaries, servers, and SaaS tools that pile up.
KPIs by growth stage
This is where this article sets itself apart. Most guides hand you a list of KPIs as if your 3-month-old startup and a 50-person scale-up should measure the same things. That's absurd. Here are the metrics that truly matter at each stage, along with what French investors look at first.

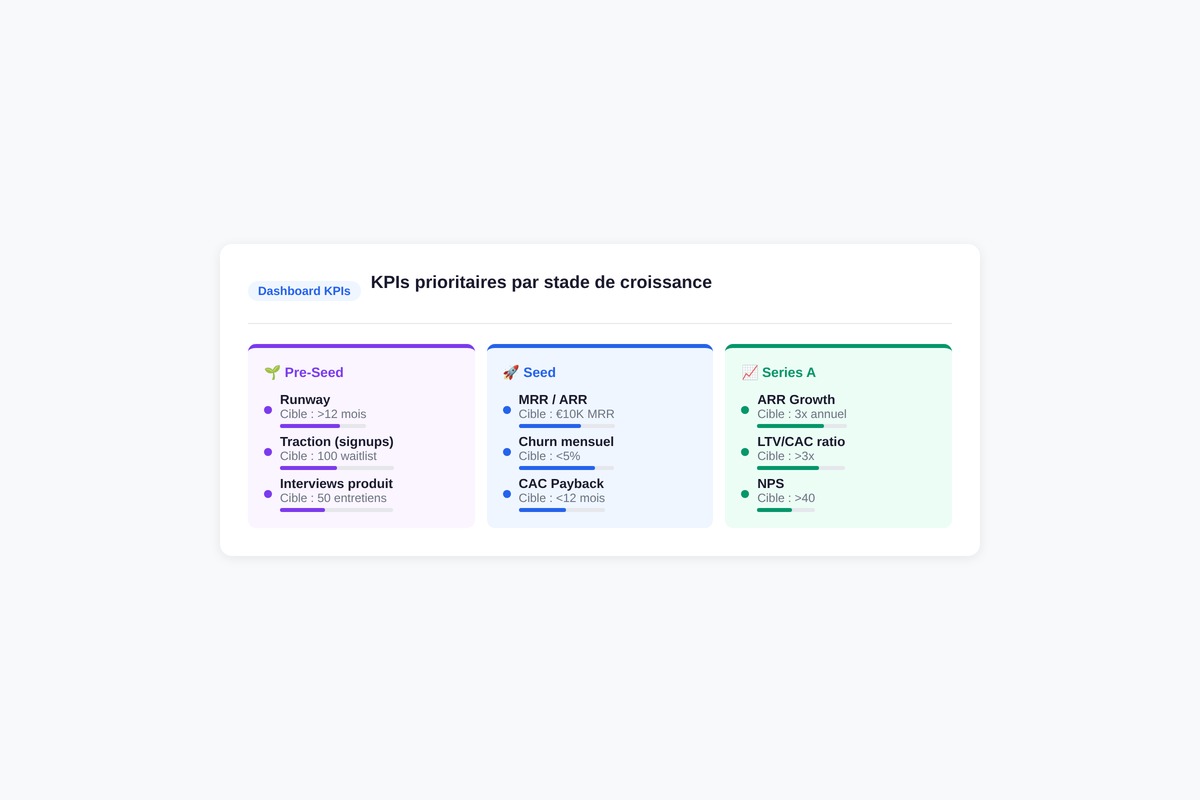
Pre-seed / Ideation (0 to 6 months): what business angels look at
You have no revenue. Maybe no product. What you do have: a hypothesis and (if you've done the work) early signals of validation. Business angels in France don't expect to see MRR at pre-seed. They're looking for something else.
The KPIs that matter:
-
Number of discovery interviews conducted. Have you spoken to 5 prospects or to 50? The difference is fundamental. A founder who has run 50 problem interviews understands their market. A founder who has done 5 is speculating.
-
Size of the addressable market (TAM/SAM/SOM). Business angels want to know whether the problem you're solving affects 500 people or 500,000. To structure this thinking, the lean canvas is a valuable tool.
-
Waitlist or beta sign-ups. 200 people signed up on a landing page with no product is a signal. 2,000 is a strong signal. The landing page conversion rate (visitors to sign-ups) is more telling than the raw number.
-
Qualitative engagement. Do your early users come back without being prompted? Do they send feedback messages spontaneously? These signals don't show up on a dashboard. You feel them.
-
Team composition. This isn't a KPI in the strict sense, but business angels invest in the founders, not the metrics. Having a technical profile on the team changes everything. If you're currently looking for your technical co-founder, check out our guide to finding a CTO.
What business angels ignore at this stage: CAC, LTV, MRR, churn. You don't have enough data for these numbers to carry any statistical meaning.
Seed (6 months to 2 years): proving traction
You have a product. Your first customers. Maybe a few thousand euros of MRR. The keyword at this phase is "traction." Seed investors want to see that something is working and that it's picking up speed.
The priority KPIs:
-
MRR and month-over-month MRR growth. The YC benchmark: 10 to 15% monthly MRR growth. That's ambitious. 7 to 10% is solid. Below 5%, investors will start questioning your product-market fit.
-
Activation rate. What percentage of your sign-ups reaches the "aha moment" (the point where they understand your product's value)? For Slack, it was 2,000 messages sent by a team. For Dropbox, it was storing a first file. Identify your aha moment and measure how many users reach it.
-
Retention at 30/60/90 days. This is the real test of product-market fit. If 40% of your users are still active after 90 days, you're onto something. If it's 10%, you have a product people try and abandon.
-
LTV/CAC ratio (first estimates). Even with limited data, start calculating. A ratio around 3:1 is reassuring. Investors know your numbers will shift, but they want to see that you're measuring and that the trend is moving in the right direction.
-
Net revenue retention. Do your existing customers spend more over time? An NRR above 100% means your customer base generates more revenue month after month, even without new customers. Above 120%, you're in the top tier.
The classic seed mistake: focusing only on acquisition and ignoring retention. Acquiring 100 customers a month is pointless if you lose 80. Plug the leaks before you open the tap.
Series A (2 years and beyond): demonstrating scalability
At Series A, the rules change. VC funds (Partech, Elaia, Breega, to name a few French players) are no longer looking for traction. They're looking for scalability. The question is no longer "does it work?" but "can it be 10x bigger?".
The KPIs VCs demand:
-
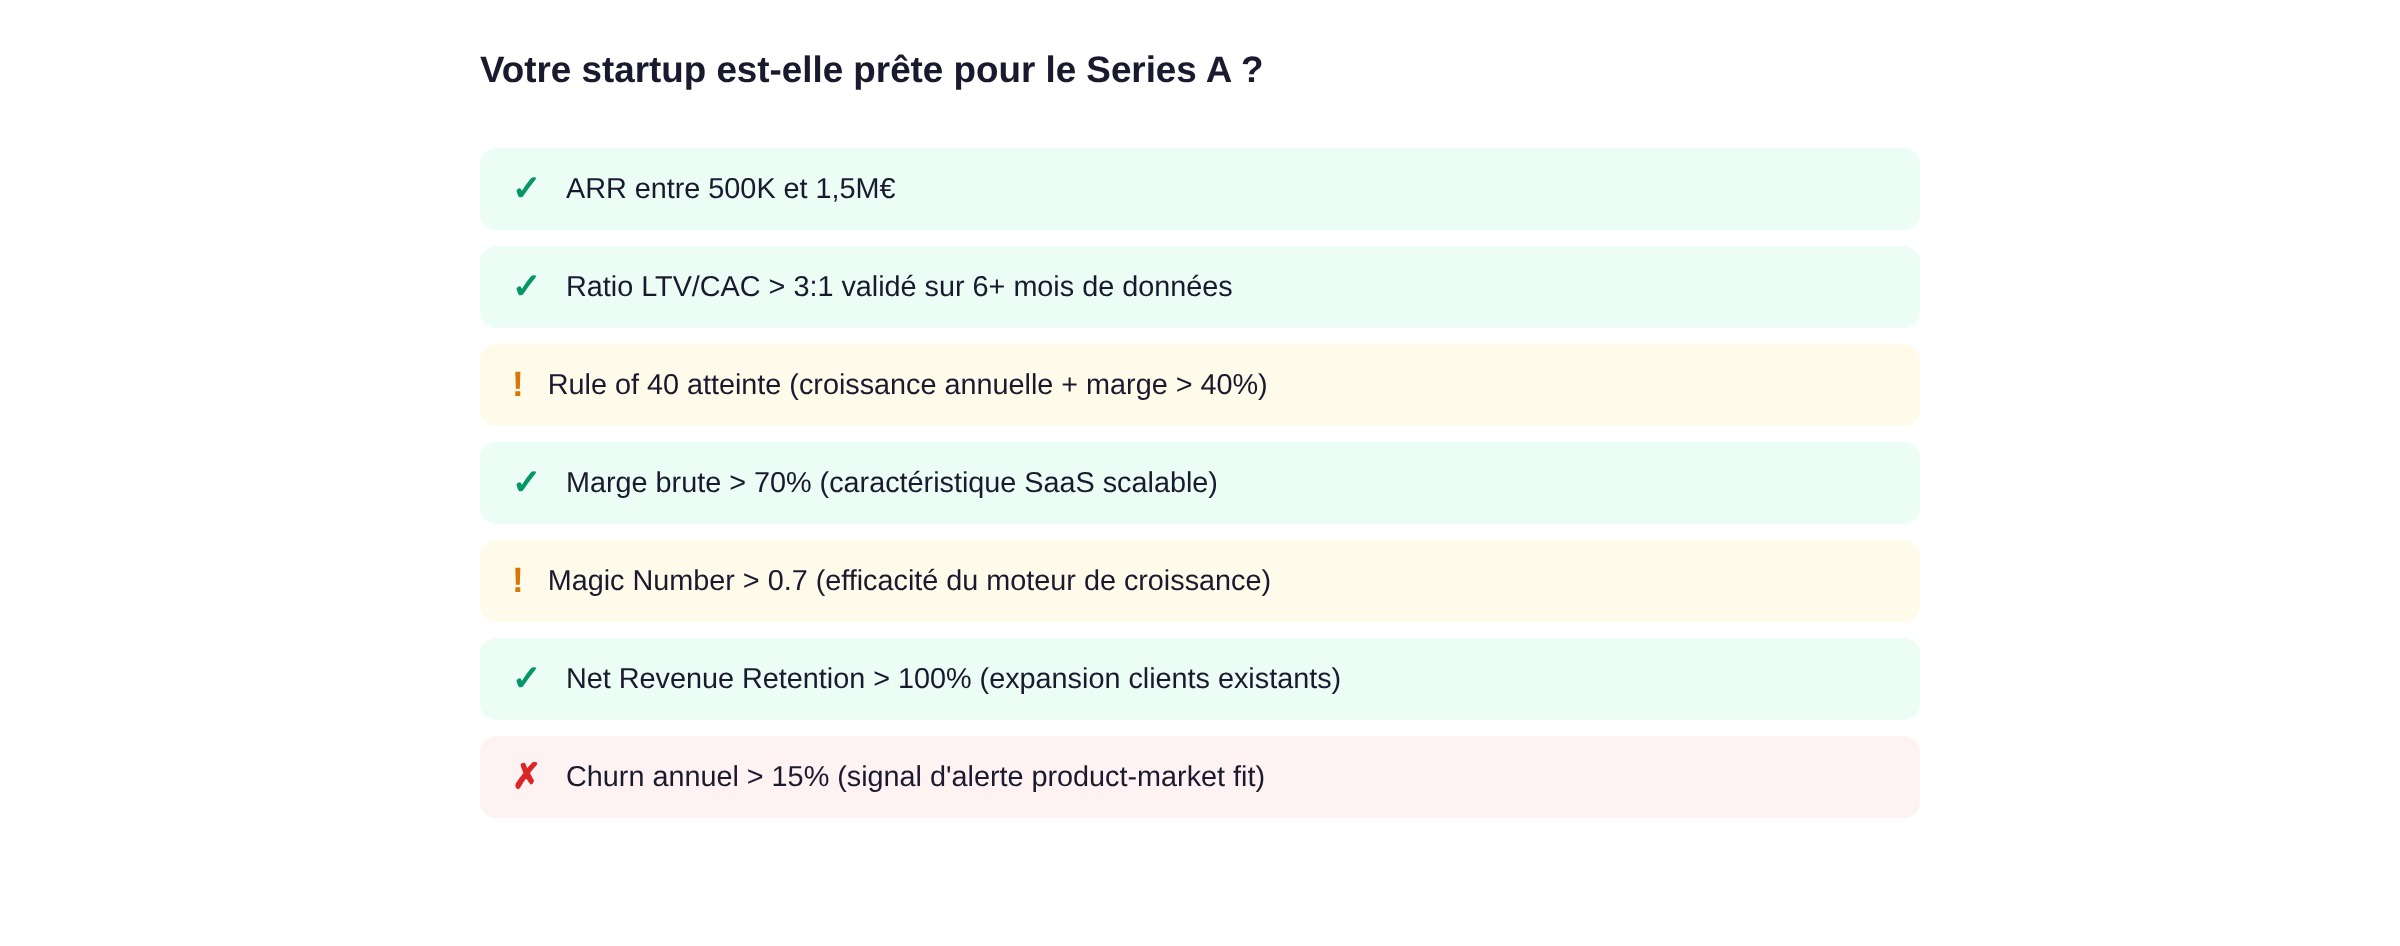
ARR and trajectory toward the million. Most Series A funds in France look for ARR between 500K and 1.5M euros (or a clear path to get there within 12 months). The expected annual growth rate: at least 2 to 3x.
-
Validated unit economics. The LTV/CAC ratio must sit solidly above 3:1, ideally between 3 and 5x. The CAC payback period must be under 12 months. These are no longer estimates: they're numbers verified over 6 to 12 months of data.
-
Rule of 40. This is the metric that combines growth and profitability: annual growth rate + net profit margin. The result must exceed 40%. A startup growing 80% a year with a -30% margin is at 50%: it passes. A startup growing 20% with a -25% margin is at -5%: it has a problem.
-
Gross margin. For a SaaS, investors expect a gross margin above 70%. Below that, your model doesn't have the characteristics of a scalable SaaS. Your cost of service (support, infrastructure, onboarding) is too high relative to revenue.
-
Sales efficiency. How much revenue does each euro invested in sales and marketing generate? The Magic Number (detailed below) is the reference indicator.
| Stage | Priority KPI #1 | Priority KPI #2 | Priority KPI #3 | What the investor wants to see |
|---|---|---|---|---|
| Pre-seed | Interviews conducted | Beta sign-ups | Market size (TAM) | "This founder understands their market" |
| Seed | MRR growth (10-15%/month) | 90-day retention | LTV/CAC ratio (≥3:1) | "The product works and people pay" |
| Series A | ARR (500K-1.5M€) | Solid unit economics | Rule of 40 | "This model can be 10x bigger" |
SaaS-specific KPIs
If you're building a SaaS (and in 2026, most French tech startups are), three additional indicators deserve your attention.
NPS (Net Promoter Score)
NPS measures how likely your customers are to recommend you. A single question: "On a scale of 0 to 10, how likely are you to recommend [product] to a colleague?". Answers of 9-10 are promoters. 7-8 are passives. 0-6 are detractors.
Formula: NPS = % promoters - % detractors
An NPS above 50 is considered excellent in B2B SaaS. Above 70, you're in the category of products that users love. Below 0, you have a major satisfaction problem.
NPS is imperfect (it doesn't tell you why people do or don't recommend you), but it has one advantage: it's a reliable proxy for word of mouth, the cheapest acquisition channel there is.
DAU/MAU ratio (engagement)
The DAU/MAU ratio (Daily Active Users / Monthly Active Users) measures how often your product is used. The higher this ratio, the more your product is part of your users' daily lives.
Benchmarks:
- 20% and up: good for a B2B tool (users open it roughly 1 day out of 5)
- 50% and up: excellent, your product is a daily tool
- Below 10%: your users aren't coming back often enough, which foreshadows high churn
For B2B tools not designed for daily use (CRM, invoicing tool, etc.), a lower ratio is acceptable. What matters is that the ratio is consistent with your product's natural usage frequency.
Magic Number (sales efficiency)
The Magic Number measures the efficiency of your sales and marketing investments. It's an indicator of how efficient your growth engine is.
Formula:
- Magic Number = (current quarter MRR - previous quarter MRR) x 4 / previous quarter sales & marketing spend
Interpretation:
- Above 0.7: your growth engine is efficient, invest more
- Between 0.5 and 0.7: decent, optimize before scaling
- Below 0.5: you're burning cash faster than you generate revenue, and you need to rethink your acquisition strategy
The Magic Number is especially useful at Series A when investors assess your ability to turn capital into growth. A high Magic Number says: "Give me more budget and I'll bring you more revenue." That's exactly what a VC wants to hear.
How to choose your KPIs (the OMTM method)
By now you know a couple dozen KPIs. Good news: you don't need to track them all. Bad news: you'll probably try anyway.
The classic mistake: tracking too many metrics
A dashboard with 47 metrics is a dashboard no one looks at. When everything is a priority, nothing is. The team scatters. The CEO watches MRR. The CTO watches load time. The Head of Sales watches the pipeline. No one is watching the same thing. The result: hour-long meetings where everyone defends their own numbers and no one makes a decision.
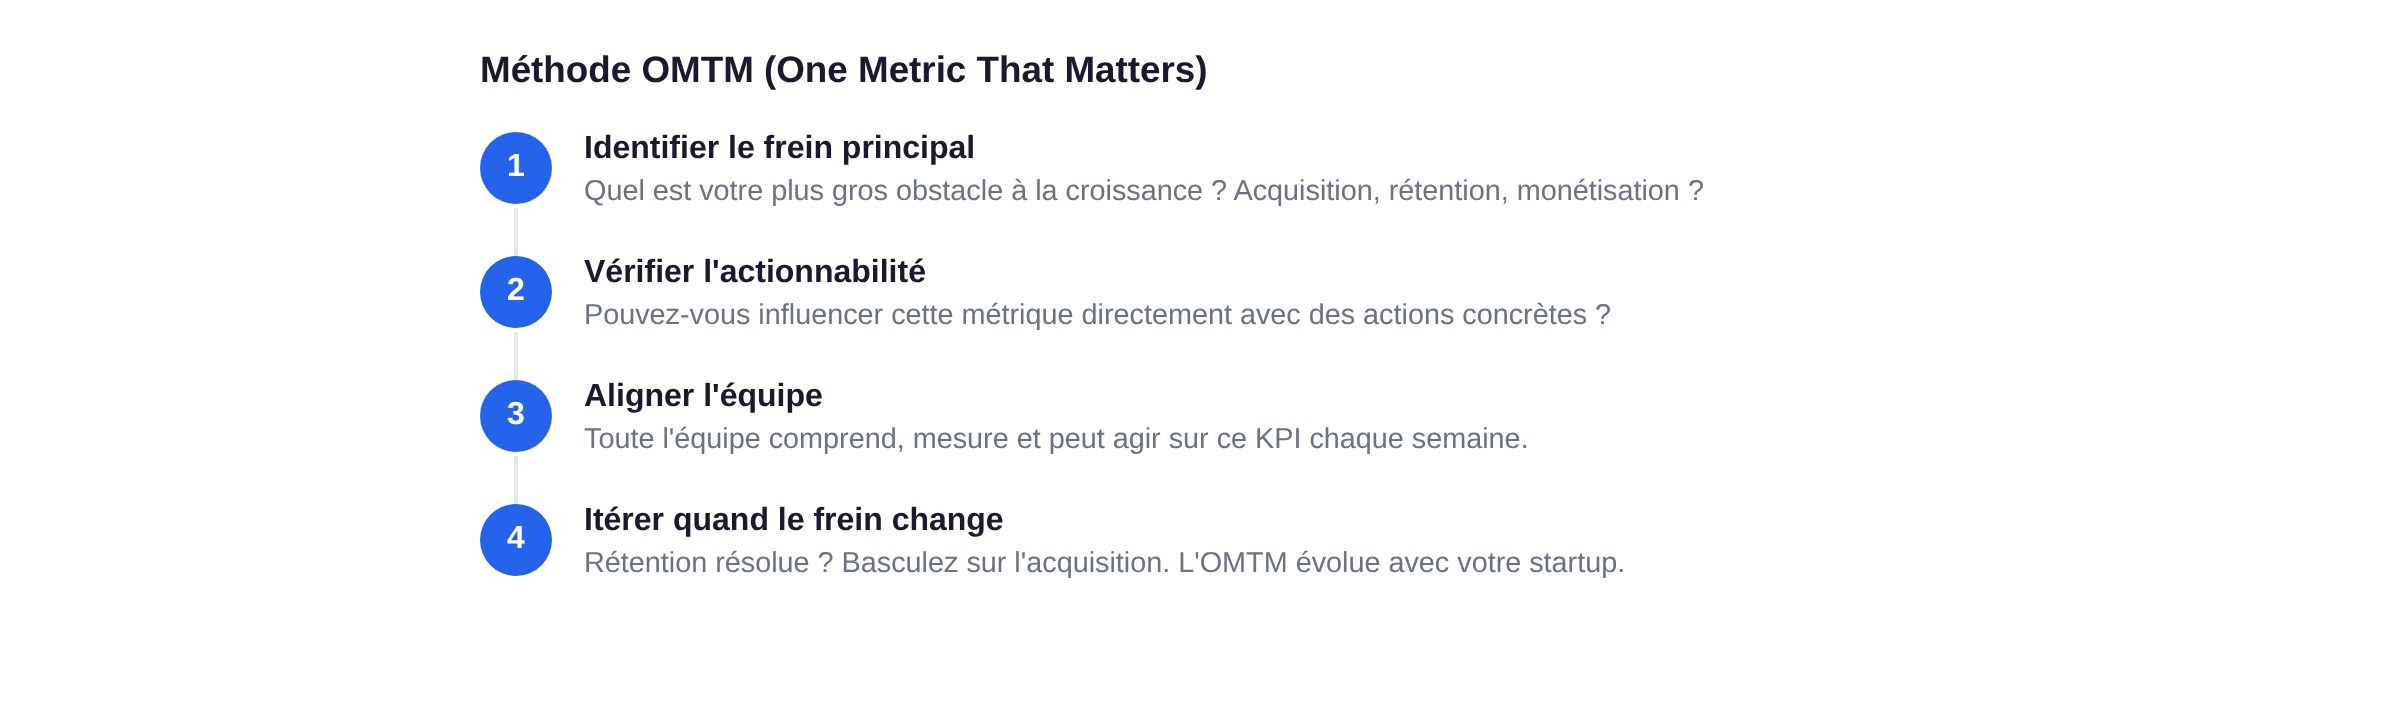
The rule of thumb: at each stage, identify 3 to 5 KPIs maximum. And among those 3 to 5, identify the one that matters most. That's the OMTM method.
One Metric That Matters (OMTM): definition and application
The OMTM concept (One Metric That Matters) was popularized by Sean Ellis, the founder of Growth Hackers. The idea is simple: at any given moment, there's one metric that captures the health and trajectory of your startup better than all the others. That's the one your whole team should know, understand, and work to improve.
It isn't the only metric you track. It's the metric your decisions revolve around.
How to choose your OMTM:
-
Identify your biggest growth bottleneck. Struggling to acquire users? Your OMTM is CAC or the conversion rate. Users leaving after 2 weeks? Your OMTM is 30-day retention. Can't monetize? It's freemium-to-paid conversion.
-
Make sure the metric is actionable. "The total SaaS market in France" isn't actionable. "Our onboarding conversion rate" is: you can change the onboarding and measure the impact.
-
Make sure the whole team can influence it. If only the founder understands the metric, it isn't an OMTM, it's a personal Excel sheet.
-
Change it when the bottleneck changes. The OMTM isn't set in stone. When your retention goes from 30% to 60%, it's time to switch to acquisition or monetization.
Table: priority KPI by profile (marketplace, SaaS, D2C)
The type of business model radically changes which KPIs are relevant. Here are the recommended OMTMs by profile and by stage:
| Profile | Pre-seed | Seed | Series A |
|---|---|---|---|
| B2B SaaS | Activation rate (aha moment) | Monthly MRR growth | Net Revenue Retention |
| Marketplace | Liquidity (% of listings with a transaction) | Take rate x GMV | Supply/demand ratio by geo |
| D2C (e-commerce) | 90-day repeat purchase rate | Contribution margin per order | Blended CAC / LTV |
| Fintech | Number of test transactions | Monthly transaction volume | Revenue per user x active base |
This table isn't a universal truth. It's a starting point. Your OMTM depends on your specific context: your stage, your model, your main acquisition channel, and the growth bottleneck you're trying to clear.
How to track your KPIs day to day
Knowing what to measure is useless if you don't know how to measure it. The tool matters less than the discipline, but a good tool reduces friction.
Free tools (Google Sheets, Notion)
For an early-stage startup (pre-seed, early seed), a well-structured Google Sheet is enough. It isn't glamorous. It works.
Google Sheets:
- Create one tab per month with your 3 to 5 KPIs
- Add a trend line (built-in sparklines)
- Share the file with the whole team
- Update it every Monday morning, not "when I have time"
Notion:
- Notion databases let you build a simple dashboard with filtered views
- The upside: integration with your other docs (meeting notes, roadmap, OKRs)
- The limit: no real data visualizations, no complex calculations
The bottom line: the tool doesn't matter. What matters is looking at your KPIs every week, as a team, and drawing decisions from them. A startup that spends 15 minutes every Monday analyzing its 3 KPIs consistently beats one with a 500-euro-a-month Tableau dashboard that no one opens.
Paid tools (Mixpanel, Baremetrics, ChartMogul)
When your data volume exceeds what Google Sheets can handle (typically beyond 50 to 100 paying customers), specialized tools take over.
Mixpanel: product analytics. Tracking user events, conversion funnels, retention by cohort. The free plan (up to 20 million events per month) is enough for most seed-stage startups. It's the reference tool for understanding how your users interact with your product.
Baremetrics: SaaS-focused. It connects directly to Stripe and displays your MRR, churn, LTV, and ARR in real time. The upside: zero configuration, the data flows in automatically from your payment tool. Pricing starts at 108 dollars per month.
ChartMogul: a competitor to Baremetrics with a more analytical interface. Advanced segmentation by plan, by cohort, by geography. Especially useful when you have several pricing tiers and want to understand which segment performs best.
Amplitude: an alternative to Mixpanel, often preferred by product teams for cohort analysis and user journeys.
The advice: don't move to a paid tool too early. As long as you can maintain your tracking in a spreadsheet with 30 minutes of work per week, that's enough. A paid tool is justified when the data volume makes manual tracking time-consuming or unreliable.
A simple dashboard template
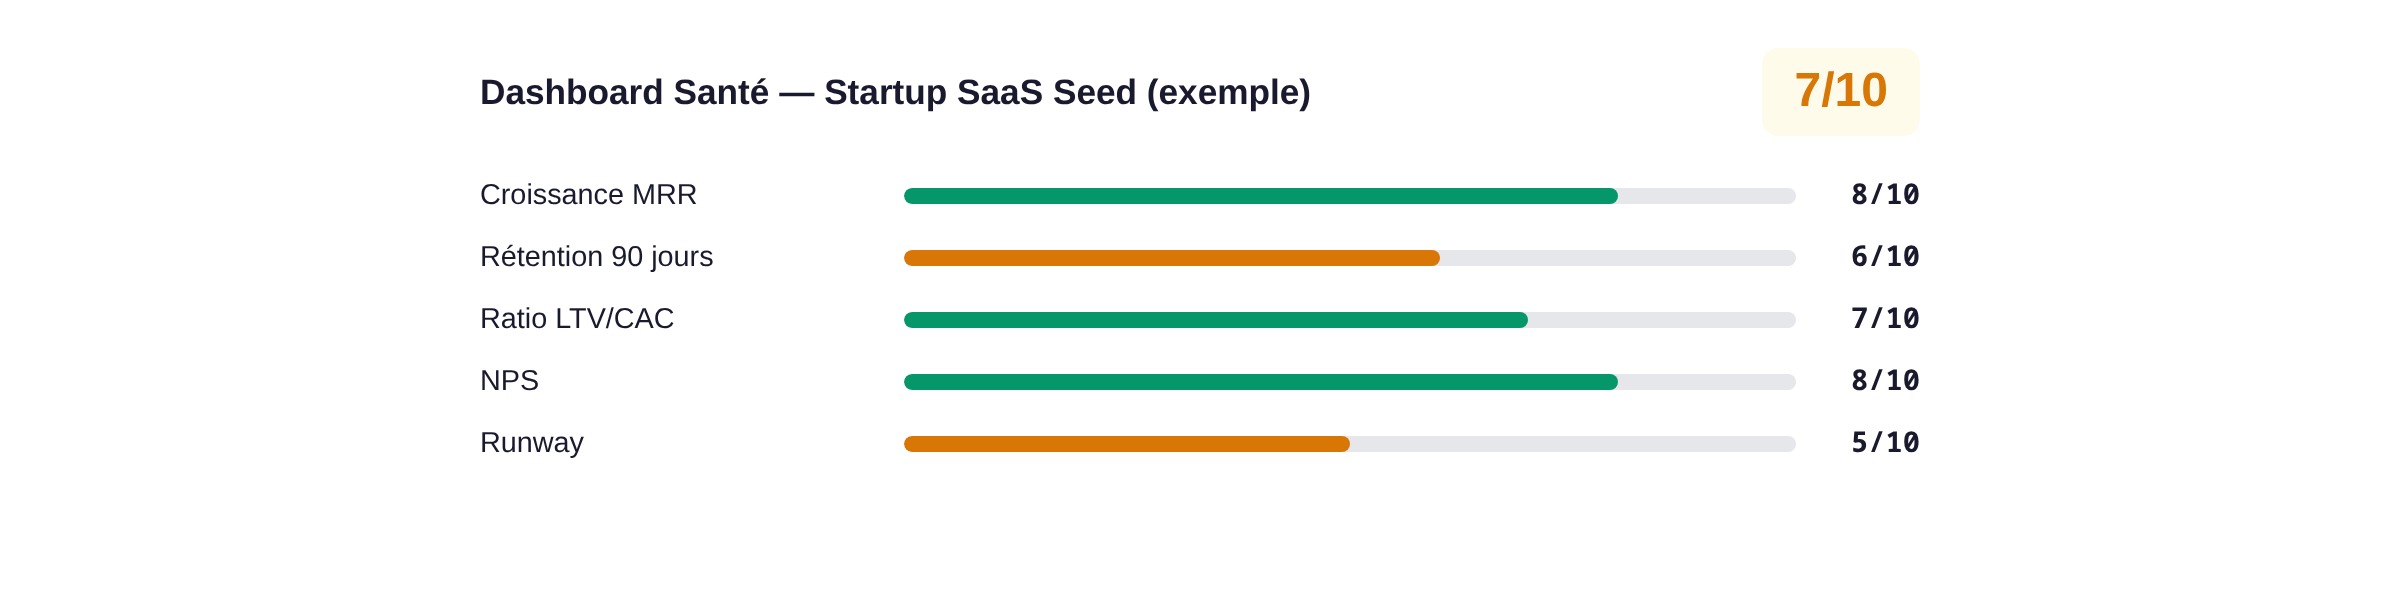
Here's the structure of a minimalist dashboard that works for 90% of seed-stage startups:
| KPI | Week N-1 | Week N | Trend | Monthly target | Status |
|---|---|---|---|---|---|
| MRR | 8,500 € | 9,200 € | +8.2% | 10,000 € | On track |
| New customers | 12 | 15 | +25% | 50 | Behind |
| Monthly churn | 2.1% | 1.8% | -0.3 pt | <2% | Achieved |
| CAC | 180 € | 165 € | -8.3% | <200 € | Achieved |
| NPS | 42 | 45 | +3 pts | >40 | Achieved |
Three critical columns:
- Trend: is it moving in the right direction?
- Target: what are you measuring yourself against?
- Status: are you on trajectory?
Keep this table front and center. First slide of your weekly meeting. The CEO's desktop wallpaper if that's what it takes. What isn't visible isn't measured. What isn't measured isn't improved.
FAQ
How many KPIs should an early-stage startup track?
Between 3 and 5. No more. At pre-seed, focus on validation signals: qualitative engagement, beta sign-ups, number of interviews conducted. At seed, shift to traction metrics: MRR, retention, activation. The most frequent mistake isn't measuring too few things, it's measuring too many and doing nothing with them. A founder who knows 3 numbers by heart and moves them every week goes faster than a founder with a 40-metric dashboard who doesn't know which one to optimize.
Which KPIs should you present to a VC investor?
It depends on the stage. At seed: show your MRR, monthly MRR growth, retention at 30/60/90 days, and your first unit economics (CAC, LTV/CAC). At Series A: add ARR, net revenue retention, the Rule of 40, gross margin, and the Magic Number. In all cases, show trends over 6 to 12 months, not a snapshot. An investor wants to see a trajectory, not an isolated number. And be transparent about your weak spots: a high churn you've identified and are working to reduce looks better than a churn swept under the rug.
How do you calculate your CAC correctly?
The basic formula: (marketing spend + sales spend) / number of new customers over the period. But the real question is what you include in "marketing and sales spend." The honest version includes marketing team salaries, sales team salaries, tools (CRM, ads, automation), advertising budgets, and the founder's time spent selling. The dishonest version includes only advertising budgets. Guess which one investors prefer. Also calculate your CAC by channel (organic, paid, outbound, referral) to understand where your most profitable customers come from. A blended CAC of 200 euros can hide an organic CAC of 30 euros and a paid CAC of 500 euros. That isn't the same reality.
MRR vs ARR: what's the difference?
MRR (Monthly Recurring Revenue) is your monthly recurring revenue. ARR (Annual Recurring Revenue) is MRR multiplied by 12. MRR is more useful day to day for tracking your trajectory month by month. ARR is the figure you communicate to investors because it gives an annualized view of your business's size. MRR of 42,000 euros sounds less impressive than ARR of 504,000 euros, even though it's exactly the same thing. Be careful: if you have annual contracts paid upfront, your ARR and your MRR x 12 can diverge. In that case, ARR is calculated based on active contracts, not on the month's MRR. Always specify your calculation method when you communicate these numbers.
Building your startup and looking to structure how you track performance? Discover the tools and methods we use at swanbase to support founders through their growth, from first pitch to Series A.