
GROWTH · Building your growth engine
1. The right metric: your North Star Metric
You have a product that solves a specific need. You have a page that sells. You're bringing in customers. You're starting to stop asking yourself every morning, "is this going to work?". And you're asking a different question: "how do I know I'm heading in the right direction?".
CH4 starts here. You're going to stop narrating your progress with anecdotes ("we signed two deals this month") and start measuring it with a single number. A number that tells you, without appeal, whether you're building something that lasts or just decorating on sand.
Why a single number, and not a dashboard
You're going to want to track everything. Visits, conversion rate, MRR, churn, NPS, MAU, leads, opportunities, CAC, LTV. You'll put all of it on a dashboard, and three months later you'll stop looking at it because you can't tell, at a glance, whether the week was good or bad.
The problem isn't the number of metrics. It's that you haven't designated which one decides. Without a deciding number, your team (or your co-founder, or you on your own) will optimize whichever number is easiest to move. You push your traffic up, your MRR stays flat. You push your NPS up, your sales don't follow. You push your lead count up, and you end up swamped without signing more.
The North Star Metric is the number that decides. Just one. When it rises, it predicts future growth. When it stalls, it warns you before revenue stalls. It's the opposite of a financial KPI: a cause, upstream of everything else.
The six criteria of a good NSM
A workable NSM meets six conditions:
The six NSM criteria
- It is a cause of growthand not a consequence
- It is holisticthe widest possible view
- It reflects the user's key experience
- It indicates the level of engagement
- It can be explained to anyone in one sentence
- It can be measured month after monthsame source, same calculation
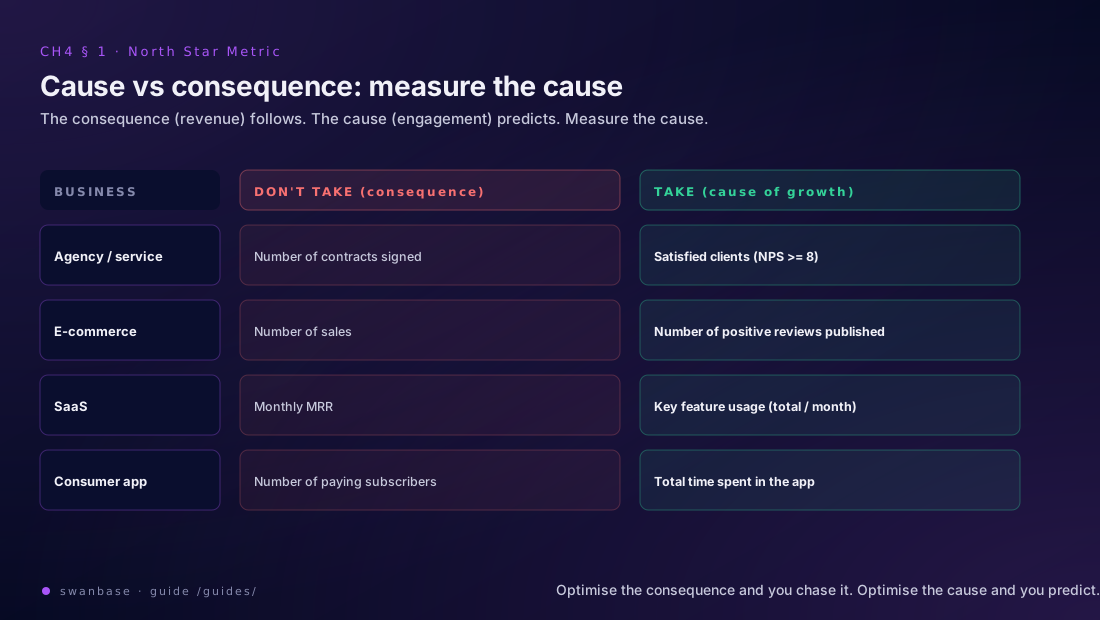
The first criterion is the most important and the most treacherous. You'll be tempted to pick your MRR, your monthly revenue, your customer count. Those are consequences. If your MRR rises, it's because something else rose first. It's that something else, your true cause, that has to be your NSM.
The common traps
Here's what founders pick first, and why it's wrong every time.
"Number of contracts signed" for an agency. That's a consequence. You learn nothing about why you sign. Better: number of satisfied clients (NPS ≥ 8). A satisfied client comes back, recommends you, brings another client when they change jobs. That satisfaction is the cause, the contract is the effect.
"Number of sales" for an e-commerce. Same problem. Better: number of positive reviews published. A review combines three things (many customers, satisfied, who take the time to write). And whoever writes in public also talks about it to their friends.
"MRR" for a SaaS. Always the same trap. Better: number of uses of the key feature over the month. If your customers use your core feature less, they'll churn. MRR only tells you that three months late.
"Number of paying subscribers" for a music app. Better: total number of minutes listened. Spotify never grew faster than while steering by this metric. Subscriptions follow when listening rises.
The causal chain NSM → revenue
A well-chosen NSM triggers a measurable chain:
NSM ↑ → engagement ↑ → retention ↑ → paying customers ↑ → churn ↓ → revenue ↑
The typical example for a fitness coaching app: number of sessions per month rises → users stay subscribed → MRR grows → conversions to annual plans rise → growth. You can see clearly that the NSM sits right at the top of the chain, and that revenue arrives at the end.
This chain also gives you a rule: if your NSM rises but your revenue stays flat six months later, your chain is broken at one stage (retention, conversion, pricing). If your NSM rises and your revenue follows, your NSM is well chosen.
The table by business type
Here's the default NSM depending on your business model. You can adapt it. Reinventing it, no.
| Business model | Default NSM |
|---|---|
| Agency / service | Satisfied clients (NPS ≥ 8) |
| E-commerce | Positive reviews published |
| SaaS | Usage of the key feature (total) |
| Consumer app | Total time spent in the app |
| Marketplace | Completed transactions |
| Media / content | Engaged reading time |
Note carefully: the total, and not the average. The average per user hides the growth in the number of users. The total captures both: how many people, and how much value each one consumes.
How the NSM evolves with maturity
Your NSM will evolve with your stage.
- 0 to 12 months: transaction or usage metrics (bookings, sessions, purchases).
- 1 to 3 years: quality metrics (positive reviews, NPS, satisfaction score).
- 3 years and up: composite or segmented metrics (NSM by customer segment).
A marketplace that's just starting tracks "number of bookings". After two years, it switches to "number of positive reviews" because the volume is there, and quality becomes the growth lever.
What doesn't change is the six-criteria rule. When you change your NSM, you reapply the six criteria to the new one, and you document why you're changing.
The end-of-section exercise
Take a sheet of paper and write:
Your NSM, in eight lines
- Business modele-commerce / SaaS / agency / marketplace / app
- NSM candidate 1
- NSM candidate 2
- NSM candidate 3
- The six criteria, ticked for each1 · 2 · 3 · 4 · 5 · 6
- NSM chosen
- Current valuemonth M
- Target valuemonth M+6
If none of your three candidates checks off all six criteria, you haven't found your cause of growth yet. It's probably because you're still confusing cause and consequence. Reread the six criteria. The first is the one you'll trip on.
Once you've chosen your NSM, you'll be able to lay it out as the output of an equation. That's what we do in section 2: we build your Growth Model.
2. Growth Model: the funnel × rates equation
You have an NSM. You know which metric decides. Now you need an equation that tells you how that metric is built, stage by stage. That equation is your Growth Model. It's your map of the system that brings you customers, with the arrows showing where you can act.
Why an equation, and not just a funnel
Most founders draw their funnel as a hopper with percentages. Visitors → leads → signed. It helps you see where you're losing people, but it doesn't tell you how much you gain if you push a lever.
An equation does. An equation lets you simulate. You can say: "if I take my conversion rate from 1% to 1.3%, my monthly revenue goes from €11k to €15k". You can tell your co-founder: "the thing with the most weight in our equation is retention. We put the next two weeks on it". The funnel shows you where it clogs. The equation tells you where to act.
The structure: rates on top, volumes at the bottom
Every growth equation follows the same two-row architecture.
| Row | What it carries | Nature |
|---|---|---|
| Top | The rates | Causes, marketing levers |
| Bottom | The volumes | Consequences, business |
The rates multiply the volumes. A volume at one stage becomes the volume of the next stage after a rate is applied.
Volume[n+1] = Volume[n] × Rate[n → n+1]
None of this feels abstract once you lay it out on a concrete case. Let's take an e-commerce.
An e-commerce example
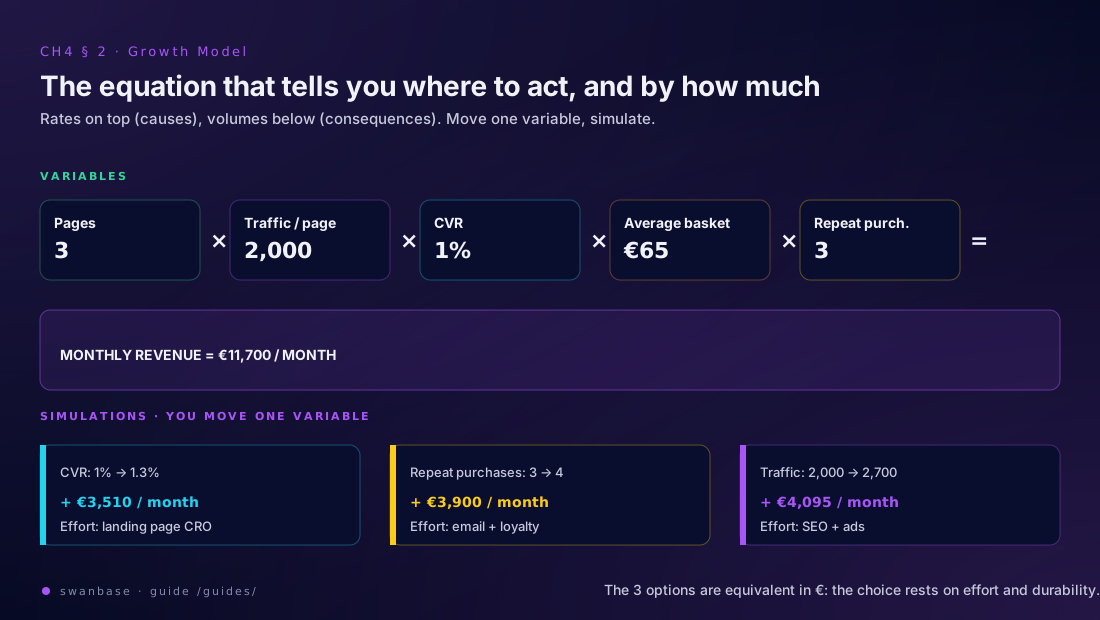
Imagine a three-product e-commerce. Its equation fits on one line:
Product pages × Traffic / page × Conversion rate × Average basket × Repeat purchases = Monthly revenue
Put numbers in it:
3 × 2,000 × 1% × €65 × 3 = €11,700 / month
You read this as: 3 product pages, each getting 2,000 visitors per month, 1% of those visitors buy, they spend €65 on average, and each customer buys 3 times over the year. Result: €11,700 / month in revenue.
This equation is your Growth Model. From here, you can play.
The simulation: move one variable, see the impact
You want to add €3,500 in monthly revenue. You have several options.
Option A: raise the conversion rate from 1% to 1.3%.
3 × 2,000 × 1.3% × €65 × 3 = €15,210 / month
Effort: CRO tests on your product pages, redesigning one zone, repositioning the CTA. Medium effort, direct impact.Option B: raise repeat purchases from 3 to 4.
3 × 2,000 × 1% × €65 × 4 = €15,600 / month
Effort: automated email marketing, loyalty program, post-purchase content. More structural effort, but more durable, because repeat purchases cost less than new customers.Option C: raise traffic from 2,000 to 2,700 per page.
3 × 2,700 × 1% × €65 × 3 = €15,795 / month
Effort: SEO, ads, content. The highest effort in cash or time, and the most dependent on the algorithm.You see immediately, just by looking at the equation, that all three options give a similar result. The choice comes down to effort and durability, not the projected number, which is equivalent.
The equations by business
Every model has its own equation. Here are the base structures.
E-commerce:
Pages × Traffic/page × CVR × AOV × Repeat purchases = Revenue
SaaS B2C:
Visitors × Signup CVR × Activation rate × Conversion to paid × ARPU × (1 − churn) = MRR
SaaS B2B (sales-led):
ICP targets × Reach × Reply rate × Meetings booked × Deals closed × ACV × (1 − annual churn) = ARR
Agency / Service:
Leads × Discovery call rate × Proposal rate × Close rate × Average basket × Recurrence = Annual revenue
Marketplace (demand side):
Visitors × Signup rate × Activation × First transaction × Recurrence × Average GMV × Take rate = revenue
You can make it more complex (add stages, split by segment, separate demand and supply for a marketplace), but you start with the simplest version, the one that fits on a single line and that you can sketch on the corner of a table.
How to build your Growth Model in one hour
Take your NSM (from section 1). Ask the question: "which upstream levers, multiplied together, produce this number?". Write the equation, stage by stage, alternating rates and volumes.
For each variable, put down:
- its current value (estimated if not yet measured)
- its source (analytics, quotes, CRM, survey)
- its growth rate over the last 3 months (if you have it)
You get a living equation. You update it every month. After three months, you can read your business in two minutes.
The sensitivity analysis
Once the equation is built, you vary each variable by +10% and look at the impact on the final result. The variable that produces the biggest swing is your most powerful lever. That's the one to focus your efforts on first (modulo the difficulty, which we cover in section 4 with ICE).
In the e-commerce example, +10% on each variable:
| Variable pushed by +10% | Monthly revenue | Gap |
|---|---|---|
| Traffic | €12,870 | +€1,170 |
| Conversion rate | €12,870 | +€1,170 |
| Average basket | €12,870 | +€1,170 |
| Repeat purchases | €12,870 | +€1,170 |
All the variables carry the same relative weight when you move them by a percentage. What changes is the difficulty of moving each one by 10%. That's what you'll prioritize in section 4.
Your equation, at the end of section 2
Your equation, on one line
- My equationa single line
- NSM as output
- Variables and current values
- Most sensitive variable× difficulty of moving it
- 3-month targeta number
- Variable to move to get there
You now have two things: a number that decides (NSM), and a map that says how it's built (Growth Model). In section 3, we diagnose your funnel stage by stage with AARRR-A to find where it leaks.
3. AARRR-A: diagnosing your funnel
You know what you're measuring (NSM, section 1). You know how it's built (equation, section 2). But you don't yet know where your system leaks. That's what AARRR-A is for.
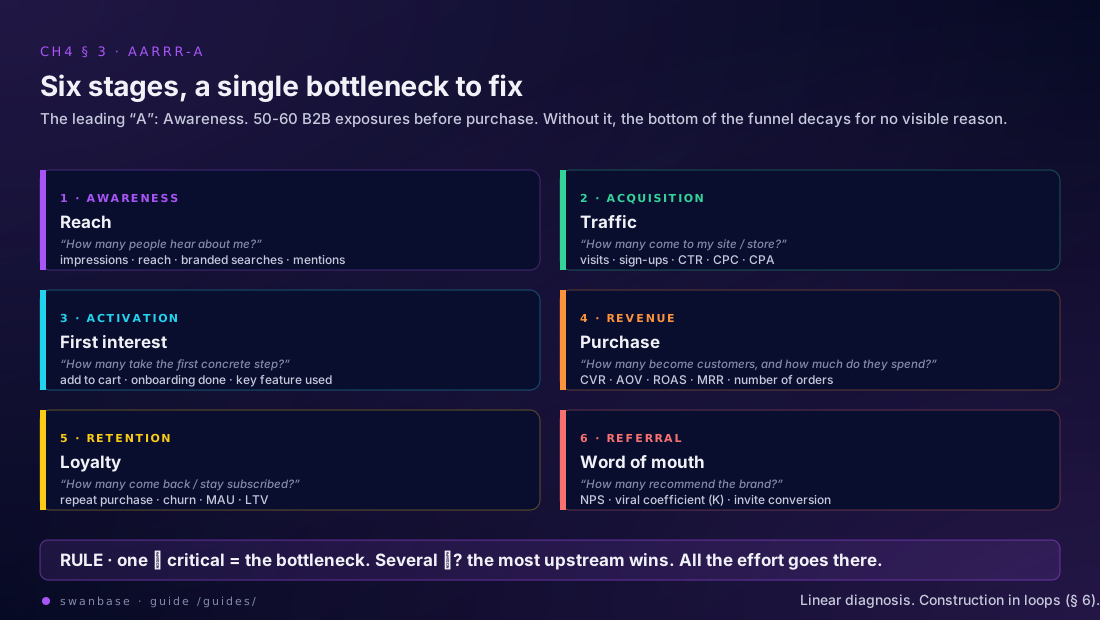
AARRR comes from Dave McClure, in 2007. "Startup Metrics for Pirates". Acquisition, Activation, Revenue, Retention, Referral. Five letters, five stages. The extra "A" out front is Awareness, which we add because in B2B (and increasingly in B2C), a buyer has seen your brand fifty to sixty times before contacting you. Without measuring that first step, the numbers at the bottom of the funnel degrade without anyone understanding why.
The six stages
Here's what each stage measures, and which question it asks.
| Stage | What it measures | The question it asks |
|---|---|---|
| Awareness | Reach | How many people hear about me? |
| Acquisition | Traffic | How many come to my site or my store? |
| Activation | First interest | How many take the first concrete step? |
| Revenue | Purchase | How many become customers, and how much do they spend? |
| Retention | Loyalty | How many come back or stay subscribed? |
| Referral | Word of mouth | How many recommend the brand? |
Each stage has its metrics, which depend on your business model.
The metrics by business type
E-commerce:
| Stage | E-commerce metrics |
|---|---|
| Awareness | Branded searches, social reach, impressions, CPM |
| Acquisition | Visits, CTR, CPC, traffic by channel |
| Activation | Add to cart, time on product page |
| Revenue | CVR, average basket, ROAS, CPA, number of orders |
| Retention | Repeat purchase rate, churn, open rate, LTV |
| Referral | NPS, referral rate, positive reviews, shares |
SaaS (B2C or B2B):
| Stage | SaaS metrics |
|---|---|
| Awareness | Brand mentions, organic traffic, impressions |
| Acquisition | Sign-ups, CTR, CPC, store visits |
| Activation | Onboarding completed, usage of the key feature |
| Usage retention | MAU, DAU/MAU, session frequency |
| Revenue | Conversion to paid, ARPU, MRR |
| Payment retention | Months subscribed, churn |
| Referral | K-factor, invite conversion |
Note for SaaS: you have two retentions to measure. Usage retention (do they keep using it?) and payment retention (do they keep paying?). The two often decouple. Someone can pay for three months without using it, then churn all at once when they notice.
Consumer app:
| Stage | Consumer app metrics |
|---|---|
| Awareness | Content reach, impressions |
| Acquisition | Downloads, store visits |
| Activation | Onboarding, first meaningful interaction |
| Retention | MAU, time per day, sessions |
| Revenue | In-app purchases, ad revenue per user |
| Referral | Shares, invites, content virality |
Marketplace:
You have two parallel journeys that converge at the transaction.
| Side | The steps, in order |
|---|---|
| Demand | Visit · browse · sign up · first transaction · recurrence · recommendation |
| Supply | Visit · discover the offering · sign up and onboard · active profile · first transaction · lasting activity |
The funnel is not linear
This is the typical trap for the founder looking at AARRR for the first time. You tell yourself: "people move from awareness to acquisition, then to activation, then to revenue". Wrong. The funnel is a series of loops.
- A referral program feeds acquisition (from the bottom, it flows back to the top).
- A prospect sees your ad several times before clicking (acquisition → awareness → acquisition).
- A paying SaaS subscriber keeps paying because they keep using it (revenue depends on retention).
- Paid acquisition gets cheaper over time if word-of-mouth reduces your overall CAC.
You work with a funnel for the diagnosis, but you build loops for the growth. That's what we cover in section 6.
Assessing the health of each stage
For each stage, you assign a status on 4 levels.
| Status | How to read it | The action |
|---|---|---|
| 🔴 Critical | The stage is blocking the system | Immediate action |
| 🟡 Watch | The stage is degrading | To address within 30 days |
| 🟢 Healthy | The stage is working | Don't touch |
| ⚪ No data | We don't know | First priority: measure |
You set these statuses once a month. At the start, lots of "⚪ no data". That's normal. Your first month is about pulling these lines up to at least 🟡 or 🟢 by putting measurement in place (Google Analytics, Mixpanel, Hotjar, whatever you want, but you measure).
Identifying the bottleneck
You have six stages with statuses. You look for the bottleneck. One only.
The rules for identifying it:
Rule 1. A 🔴 critical is always the bottleneck. If you have several, take the one furthest upstream in the funnel. An upstream problem cascades downstream, so fixing a 🔴 in activation will probably improve revenue too.
Rule 2. If you have no 🔴, take the 🟡 with the most critical findings accumulated.
Rule 3. If everything is 🟢, take the stage with the most medium findings, or the lowest relative performance.
The bottleneck is the stage where you put your next efforts. All of them. Not 30% on acquisition, 30% on activation, 40% on retention. Everything on the bottleneck. You'll come back to the other stages once this one turns 🟢.
The typical example of the early founder
You launch. You do founder-led content (CH3, section 6). You send cold DMs (CH3, section 7). You fill out your page (CH3, section 4). You run your first AARRR-A diagnosis and you get:
| Stage | Status | Reading of the month |
|---|---|---|
| Awareness | 🟡 | Traffic rising, but 90% direct: no SEO, no organic |
| Acquisition | 🟢 | Site visits are fine |
| Activation | 🔴 | 80% of visitors leave without starting a trial |
| Revenue | ⚪ | Not enough volume to conclude |
| Retention | ⚪ | No cohorts old enough yet |
| Referral | ⚪ | Not measured |
Your bottleneck is activation. Every action this month goes there. You don't spend one more euro on acquisition until your activation is at least 🟡. Investing in acquisition at this stage is pouring water into a leaky bucket.
The ICE bonus for the bottleneck
In section 4, we prioritize actions with an ICE score. Any action that directly addresses the bottleneck stage gets an Impact bonus of +2. It's a simple rule that forces discipline: you'll be tempted to do the "easy" action on a non-bottleneck stage. The bonus reminds you the value is elsewhere.
Your AARRR-A diagnosis, set down
Your diagnosis of the month
- Awarenessstatus · metric · value
- Acquisitionstatus · metric · value
- Activationstatus · metric · value
- Revenuestatus · metric · value
- Retentionstatus · metric · value
- Referralstatus · metric · value
- Bottleneck identifiedone only
- One action proposed on it
You have a diagnosed funnel. Now you'll prioritize your ideas with ICE so you don't lose weeks on the wrong actions. That's what section 4 is about.
4. ICE: prioritizing your ideas without spreading thin
You have a diagnosed funnel, an identified bottleneck. You no longer have a strategic question ("where to act?"), you have a wall of tactical ideas ("what do I do this week?"). If you don't have a method for choosing, you'll do what's easy, not what matters. ICE fixes that in three columns.
The formula
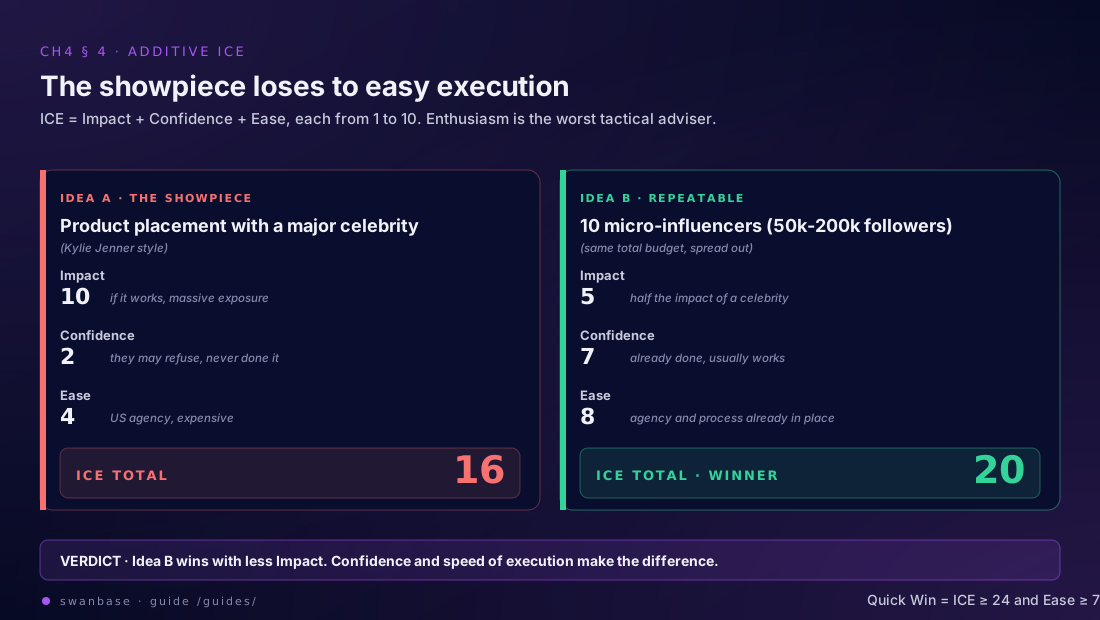
ICE score = Impact + Confidence + Ease (3 to 30)
Each factor runs from 1 to 10. The total runs from 3 to 30. It's simple, it's additive, it's fast.
You'll see multiplicative versions online (I × C × E, running from 1 to 1000). That was the original version, popularized by Sean Ellis. The problem with the multiplicative one: a single weak factor (say an Ease of 1) mechanically kills the idea even if Impact and Confidence are at 10. You get scores like 100 that you can't compare against each other. The additive version is more readable and more stable.
The three factors
Impact. If it works, how big is it?
| Score | Reach of the action |
|---|---|
| 9-10 | A 🔴 critical on the bottleneck stage |
| 7-8 | A 🔴 critical elsewhere, or a 🟠 on the bottleneck |
| 5-6 | A 🟠 elsewhere, or a 🟡 on the bottleneck |
| 3-4 | A 🟡 elsewhere, or a stage outside the bottleneck |
| 1-2 | Cosmetic |
Bottleneck bonus: +2 on Impact if the action directly addresses the stage you identified in section 3.
Confidence. How sure are we that it'll work?
| Score | What you're leaning on |
|---|---|
| 8-10 | Precise data: exact CPA, exact CVR, a previous A/B test |
| 6-7 | Industry best practice, plus a bit of data |
| 4-5 | Reasonable hypothesis, little data |
| 1-3 | A bet, intuition, never tried |
Repeat bonus: +1 if this recommendation carries over from a previous report. The things we've already recommended have accumulated a bit of context.
Ease. How simple and how cheap is it?
| Score | Execution load |
|---|---|
| 9-10 | Under an hour in the UI: a setting, a toggle, pausing a keyword |
| 7-8 | One to two days: a campaign, an audience, a bid strategy |
| 5-6 | One to two weeks: creative or a page |
| 3-4 | Technical work: tracking, API, dev |
| 1-2 | Organizational work: external vendor, multi-week project |
Ease combines effort (time, skills) and cost (budget, human resources). Don't split the two.
Two examples side by side
Idea A: product placement with a big celebrity (Kylie Jenner style).
| Factor | Score | Why |
|---|---|---|
| Impact | 10 | If it works, massive exposure |
| Confidence | 2 | They may refuse, never done it |
| Ease | 4 | Needs a US agency, expensive |
| ICE | 16 |
Idea B: 10 product placements with micro-influencers (50k-200k followers).
| Factor | Score | Why |
|---|---|---|
| Impact | 5 | Half the exposure of a celebrity |
| Confidence | 7 | Already done, usually works |
| Ease | 8 | The agency and the process are in place |
| ICE | 20 |
Idea B wins. Not because it has more impact (it has less), but because it's more likely to work and faster to execute. ICE forces this calculation that founders forget in the heat of enthusiasm.
Quick Wins: to be separated out at the top of the list
An idea is a Quick Win if:
Quick Win = ICE ≥ 24 and Ease ≥ 7
Quick Wins are what you do this week. You have five, you do them. You have zero, you keep looking (probably by raising the Ease of your ideas, or by breaking an idea into simpler sub-actions).
You can't have 20 Quick Wins. Maximum 5 per cycle. Beyond that, either your list is too optimistic on Ease, or your bottleneck is easier to fix than you thought (and so much the better).
The "score together" rule
ICE scores are relative, not absolute. They only make sense compared to other scores made in the same session, by the same people, on the same context.
That means three practical things.
First, you can't compare an ICE score from this month to an ICE score from last year. The contexts have changed. If you carry over an idea from last year, you re-score it today.
Next, if you work with a co-founder, you score together, not each on your own side. Individual calibrations diverge fast.
Finally, don't score an idea in a vacuum. Score it next to 5 or 10 others. The absolute score means nothing, it's the relative position that decides.
The limits of ICE you should know
ICE has two known weaknesses.
Subjectivity (acceptable). The scores are arbitrary. But since you compare within a single session, it stays usable. You're not optimizing a single decision, you're sorting a bag of 20 ideas.
Missing external factors (a real limit). ICE doesn't account for market opportunities, competitive threats, or outside shocks. As you get more mature, you can extend ICE with additional factors: estimated revenue in €, estimated cost in €, level of competitive risk. But at the start, keep it simple.
Applying it to the bottleneck from section 3
Take your bottleneck from section 3. You apply the +2 Impact bonus to every idea that addresses it. You score 10 ideas. You take the top 3-5 (Quick Wins first). You execute them the following week.
On the example from section 3 (activation 🔴 at an early founder), a typical list might look like:
| Idea | I | C | E | ICE |
|---|---|---|---|---|
| Onboarding redesign with a walkthrough | 8 +2 | 6 | 4 | 20 |
| Automated welcome email D0 · D3 · D7 | 7 +2 | 7 | 8 | 24 · Quick Win |
| 90-second video on the landing page | 5 | 6 | 7 | 18 |
| CTA button color change | 2 | 4 | 10 | 16 |
| Personal call on D+1 for every signup | 6 +2 | 8 | 6 | 22 |
Idea 2 is the Quick Win of the week. Idea 5 is the follow-up action for the week after. Idea 4 waits.
Your scored list, at the end of section 4
Your list of the month, scored
- 10 raw ideasno filter
- For each oneI + C + E + bonus = score
- Quick WinsICE ≥ 24 and Ease ≥ 7
- Top 3 for this week
- Top 3 in two weeks
You have a method to decide. Now we tackle "how you grow", not just "where you grow". That's what section 5 is about: the three growth paths.
5. The three growth paths
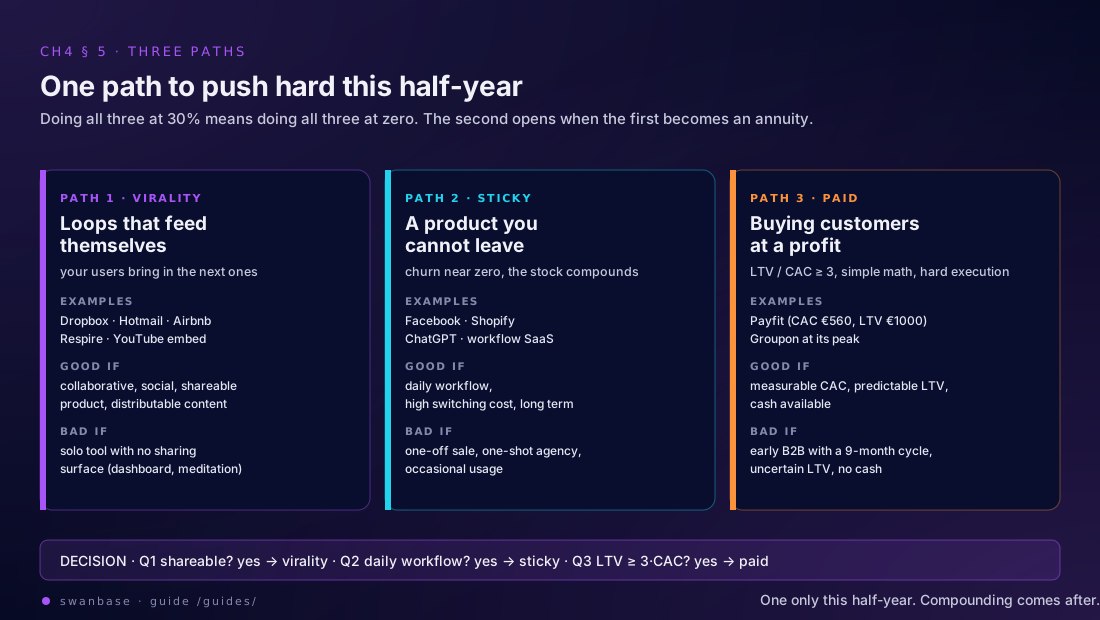
At this point you have a funnel, a bottleneck, an ICE score. You know where to act. You don't yet know which type of growth you're building. There are three, and most founders try all three at once without doing any single one well. You have to choose one (and only one at this stage).
Why a single path, not three
Each path demands different skills, different tools, different assumptions. Doing the three at 30% is doing the three at 0% well. The companies that succeed in the early stage pick one primary path, push it until it saturates, and open the second when the first becomes a source of steady income.
The three paths, in the order they're usually presented: virality, the sticky product, paid acquisition. None is better than the others in the absolute. The right one depends on your product, your ICP, and your stage.
Path 1: virality (self-feeding loops)
Virality is when your users bring in other users, without you paying for it. It can happen at any stage of the funnel, not just at referral.
| Type of loop | Example | Stages crossed |
|---|---|---|
| Classic referral | Dropbox: invite a friend, get storage | Referral → Acquisition |
| Content / awareness | Respire: viral LinkedIn video, then the Monoprix deal | Awareness → Acquisition → Awareness |
| Embedded | Hotmail: "PS: I love you. Get your free email" | Usage → Awareness |
| Platform | YouTube: the player embedded on third-party sites | Usage → Acquisition |
| Cross-platform | Airbnb: listings auto-posted to Craigslist | Activation → Acquisition |
Virality can compress 2-3 years of growth into 6 months. But it's hard to manufacture and hard to maintain. You don't decide that something goes viral. You put a mechanism in place that can go viral, and you let it run.
When to choose this path: your product has a usage effect that makes people want to invite someone (collaborative, social, shareable). Or you do content (media, app, community) and you can craft an asset that spreads on its own.
Avoid this path if: your product is used solo and has no sharing surface (a solo accounting analysis tool, a personal meditation app, an internal dashboard). Virality won't happen, no matter what you do.
Path 2: the sticky product
Growth through extreme retention. You build a product so good that no customer leaves. Every new customer is a permanent addition to your base.
The marks of a sticky product
- Churn close to zero
- High switching coststechnical, social, contractual
- Unique value or network effects
- Every new customer becomes permanent revenue
- Survival doesn't depend on continuous acquisition
Public examples: Facebook (your contacts are there, nowhere else), Shopify (no serious competitor that scales like it), ChatGPT (built into daily workflows since 2023). These companies aren't on the "hamster on a wheel" treadmill. They've built a product you can't really leave.
When to choose this path: you're on SaaS or an AI tool, your product embeds into a user's daily workflow, the migration effort is non-trivial. You're playing the long game.
Avoid this path if: you sell a one-off product (e-commerce with no recurrence), a one-time service (a one-shot agency), or occasional usage (event booking). Sticky isn't an option.
Path 3: paid acquisition (CAC < LTV)
You buy customers at a price below what they bring you over their lifetime. Simple math, hard execution.
The rule:
LTV / CAC ≥ 3
If you can acquire a customer for €200 and they bring you €600 over 3 years, you can scale. The more you buy, the more gross margin you make. The constraints are on the platforms (ad costs rise as your competitor pays more), on your positioning (CTR drops if your message no longer stands out), and on your cash (you pay for acquisition in month M, you collect the LTV over months M+1 to M+36).
Public examples: Payfit ("it costs €560 to acquire a customer, who generates €1,000 in the first year"). Groupon at its peak ("a customer generates €90 in the first year, we want 500,000 new customers, budget = €45M").
When to choose this path: your CAC is measurable, your LTV is predictable, your margins support the math, you have cash or access to cash (a raise, financing, high net margin).
Avoid this path if: your CAC is higher than your LTV (or too uncertain), you sell very early B2B with a 9-month sales cycle (you don't have the signal data), or you don't have the cash. In that case, go back to paths 1 or 2.
How to know which path is yours
Ask yourself these questions, in this order, and answer honestly.
| The question | If yes | If no |
|---|---|---|
| Does my product make people want to invite someone? | Path 1, virality, is in play | Go to question 2 |
| Does it embed into the daily workflow enough to make migrating painful? | Path 2, sticky, is in play | Go to question 3 |
| Is my LTV worth at least 3× my CAC, and do I have cash? | Path 3, paid, is in play | None of the three is open: go back to founder-led in CH3 section 5, raise your manual volume, wait for the signals |
You can have two paths in play at once. You still choose ONE as the primary, and you push 80% of the half-year's effort onto it. The other waits.
Wanting to do everything at once
You'll be tempted to tell yourself "I'll do all three". That's the trap. Here's what happens when you do all three in parallel in the early stage:
- Your content for virality never takes off because you give it 2h a week instead of 10h.
- Your product never reaches stickiness because you build 3 mediocre features instead of 1 excellent one.
- Your ad campaigns don't convert because you don't have the time to iterate on them.
Six months later you have zero path that works, and you wonder why. The answer: you didn't do any path seriously.
Compounding between paths (later)
When one path is running, you can open the second. And then they reinforce each other.
You do paid (path 3) on sticky SaaS (path 2): your LTV rises because customers stay, so your paid math improves. You do viral (path 1) on sticky SaaS (path 2): your new entrants don't churn, so your stock accumulates. You do viral + paid: you reduce your effective CAC because a portion of your new customers are free.
But you reach that compounding because you succeeded at one path first. Not by launching all three at the same time.
Your path, at the end of section 5
Your path for the half-year
- Primary patha single name
- Why that oneone sentence, resting on the three questions
- Lever number 1 to push
- Path set aside at this stageand why
- The second path, if the first saturates
You have your path. In section 6, we dig into virality specifically because it's the least understood path and the most powerful when it works: growth loops at each stage of your funnel.
6. Growth loops at each stage
The funnel has a flaw. It starts on the left and ends on the right. You put awareness in at the input, you get revenue at the output. If you want more revenue, you need more awareness. Linear, costly, fragile.
A loop is different. The output feeds the input. The more revenue you have, the more awareness you have. The more you activate, the more you acquire. The output becomes the input. That's what we call a growth loop, and it's what separates the companies that grow once from the companies that compound their growth.
Why loops beat funnels
With a linear funnel, your growth depends on the tap at the top. You stop the ads, you stop the growth. With a loop, you turn the tap on once, and the loop runs on its own energy.
Three practical differences:
| Funnel | Loop |
|---|---|
| Linear | Self-reinforcing |
| External tap | The output feeds the input |
| Stable marginal cost | Decreasing marginal cost |
| Fragile as soon as you stop | Resilient once launched |
No company that scales runs on a pure funnel. They all run on at least one loop. The problem is that most founders don't know the loop can exist at any stage of the funnel, not just at referral.
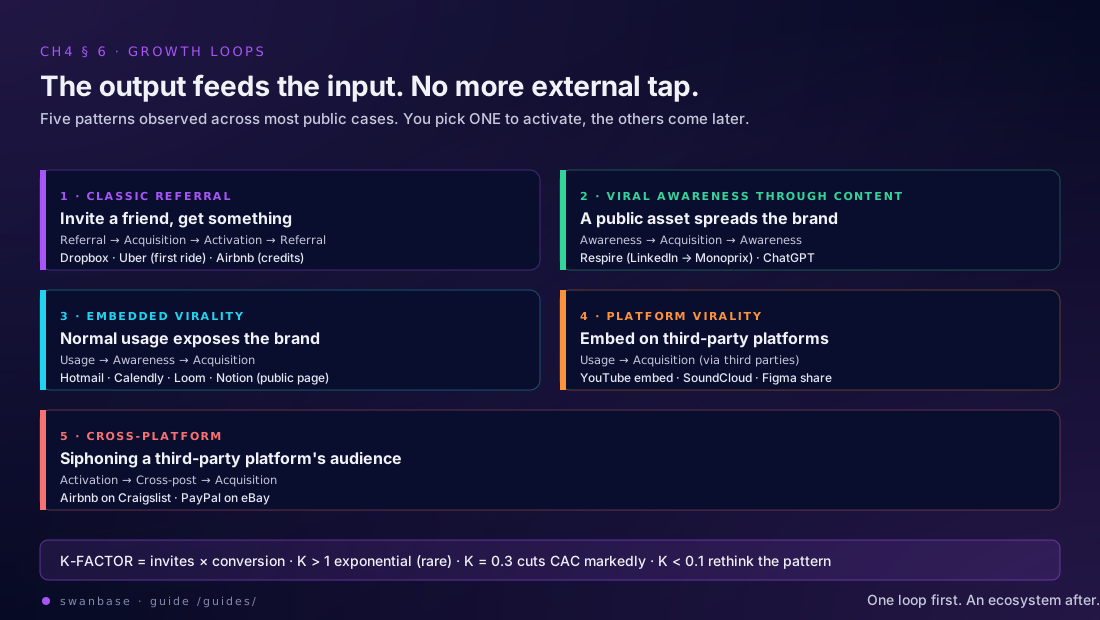
The five loop patterns you find everywhere
Here are the five archetypes seen in the majority of public cases.
Pattern 1: classic referral. A user invites another user, and gets something in exchange. Dropbox turned it into the textbook case. "Invite a friend, get 500 MB of storage." Loop: Referral → Acquisition → Activation → Referral.
Pattern 1 · Classic referral
- StagesReferral → Acquisition
- SurfaceExplicit invite inside the product
- CasesDropbox, Uber (first ride), Airbnb (credits)
Pattern 2: viral awareness through content. A user publishes something that talks about your product (or that you made yourself) and it reaches a large number of people who discover your brand. Respire (zero-waste cosmetics) exploded on LinkedIn with a viral video that led to a Monoprix deal. Loop: Activation → Content → Awareness → Acquisition.
Pattern 2 · Viral awareness through content
- StagesAwareness → Acquisition → Awareness
- SurfacePublic content: LinkedIn, X, YouTube, podcast, blog
- CasesRespire, ChatGPT every time an answer goes viral
Pattern 3: embedded virality. Your product, in its normal use, exposes your brand to third parties. Hotmail in the 90s set the most-copied example: every email sent from Hotmail ended with "PS: I love you. Get your free email at Hotmail." The recipient of the email discovered Hotmail simply because the sender was using it. Loop: Usage → Awareness → Acquisition.
Pattern 3 · Embedded virality
- StagesUsage → Awareness
- SurfaceA product output, public or semi-public
- CasesHotmail, Calendly (public link), Loom (shared video), Notion (public page)
Pattern 4: platform virality. Your product produces an asset that embeds on other platforms, which bring you traffic. YouTube exploded because its player embedded on every site on the web. Loop: Usage → Distribution on third-party platforms → Acquisition.
Pattern 4 · Platform virality
- StagesUsage → Acquisition, through a third party
- SurfaceEmbed, iframe, link, snippet, export
- CasesYouTube embed, SoundCloud embed, Figma share link
Pattern 5: cross-platform. You siphon the audience of a third-party platform, legally or in a gray zone, and you redirect it to your place. Airbnb early on auto-posted its listings on Craigslist (the big classifieds site of the time), scooping up the Craigslist audience in the process. Loop: Activation → Cross-post → Acquisition.
Pattern 5 · Cross-platform
- StagesActivation → Acquisition, through a third party
- SurfaceAuto-post, integration, audience siphoning
- CasesAirbnb on Craigslist, PayPal on eBay where sellers imposed it on buyers
How to choose the pattern for your product
Ask yourself three questions, in this order.
Question 1: does your product put out something a user already shares naturally?
A Calendly link, a Loom video, a Figma design. The user shares it because it's their normal use. You choose pattern 3 (embedded) or pattern 4 (platform). You don't need to push the sharing, it already exists. You improve the branding on the output.
Question 2: does your product carry a collaborative or social dimension?
A tool shared across a team, a product where you're better in a group. You choose pattern 1 (referral) with an invitation mechanism. The user has a personal incentive to invite because they benefit from it too.
Question 3: your product has neither a shareable output nor a collaborative dimension.
You turn to pattern 2 (viral awareness through content). You're the one producing the viral asset, founder-led (see CH3 section 6). Slower to set up, more demanding to maintain, but it also works for solo products (dashboards, analytics tools, personal apps).
The trap of "I'll add a referral program and that's it"
You'll be tempted to add a referral program to a product that isn't suited for it. "Invite a friend, get 10% off." You'll spend weeks on this thing, and get zero results. The referral loop doesn't work by magic. It works when:
- The user has a personal reason to invite (they gain something from it).
- The invited person has a reason to come (the product already speaks to them).
- The sharing is trivially easy (one click, not a form).
If your product doesn't meet all three, you don't force the loop. You switch patterns.
Measuring a loop: the K-factor
The K-factor measures whether your loop is sustainable.
K = Invites per user × Conversion rate of invites
- K > 1: organic exponential growth (extremely rare, few products get there).
- K = 0.5 to 1: the loop doesn't self-feed, but it reduces your effective CAC.
- K < 0.1: your loop doesn't hold, rethink your pattern.
Example: 100 customers, 10% bring in a new customer within 30 days. K = 0.1. Not self-sustaining, but your CAC drops by 10% on new entrants. That's already a gain. Above 0.3, your growth becomes clearly less dependent on paid.
The beginner mistake: "I build one loop and that's it"
You don't have one loop. You have several, at different stages, that reinforce each other or don't.
A classic B2B SaaS often has three parallel loops:
- A content loop (founder-led, blog, podcast) that brings in awareness.
- An onboarding loop (a new customer invites their colleagues to use the product) that amplifies usage.
- A product loop (every user action produces an output a third party can see) that brings in acquisition.
You don't build all three at the same time. You build one, you stabilize it, you add another. But in the end, you don't have a loop, you have an ecosystem of loops. That's what compounds your growth, and it's the subject of section 8.
Your loop, at the end of section 6
Your loop, in five lines
- Pattern you can activate nowone of the five
- Output or surface used as the lever
- Target K-factor at 6 monthsa number
- Pattern number 2, in 6 months
- Pattern set asideand why
You have a diagnosed funnel (section 3), prioritized actions (section 4), a growth path (section 5), and a loop that can self-feed (section 6). In section 7, we put all of it into a weekly ritual: the Growth Flywheel.
7. The weekly Flywheel: your operating ritual
You have a funnel, an NSM, prioritized ideas, a growth path and a loop. You have everything you need to move. What's left is turning it into a weekly ritual. Otherwise you'll do 2-3 good weeks, then miss a week, then never come back to it.
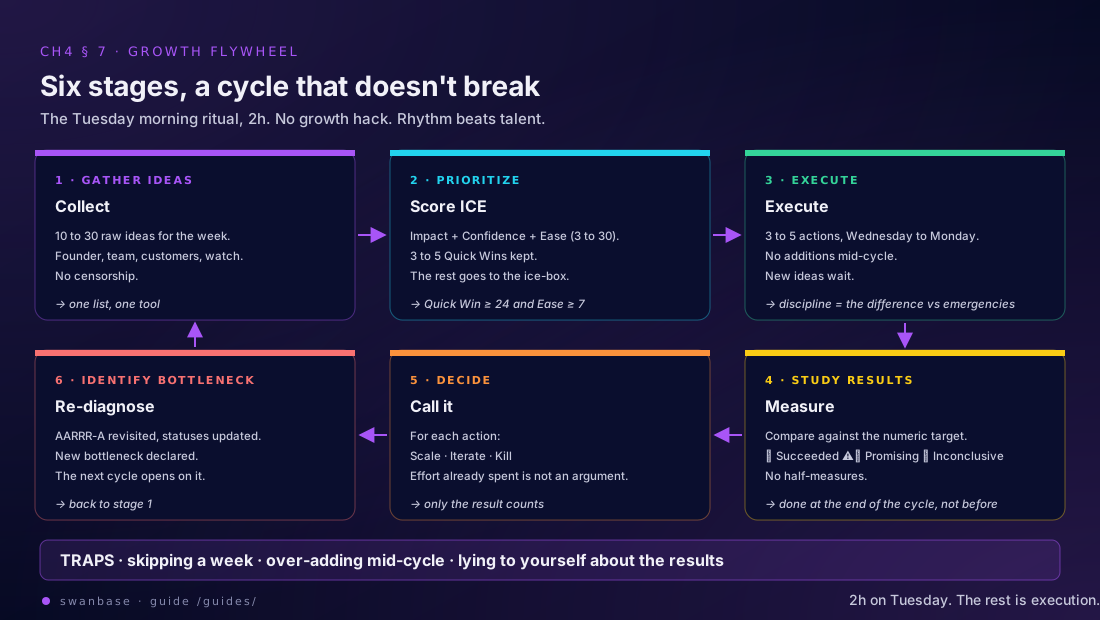
The ritual is called the Growth Flywheel. It's the same at the companies that scale. It's just a cycle that repeats the same sequence every week or every two weeks.
The full cycle
Gather Ideas → Prioritize (ICE) → Execute → Study Results → Decide → Identify Bottleneck → start again
Each turn of the flywheel closes one cycle and opens the next. You start on a Tuesday, you finish the following Tuesday. You start over. Nothing spectacular, no "growth hack" either: just the rhythm.
The six stages of the flywheel
Stage 1: Gather Ideas. You collect raw ideas for the week. Unfiltered. A list of 10-30 lines on a Notion / Google Doc. You include ideas from the founder, the co-founder, the team, customer feedback, your competitive watch. No censoring at this stage.
Stage 2: Prioritize (ICE). You apply the ICE score from section 4. You identify the Quick Wins (ICE ≥ 24, Ease ≥ 7). You keep 3 to 5 actions. You drop the rest for this week (but you keep it in an "ice box" for the following month).
Stage 3: Execute. You execute the 3-5 actions. You don't add others mid-week ("brilliant idea on Thursday at noon"). You note them on the list for the next cycle.
Stage 4: Study Results. At the end of the week or cycle, you look at the results. You compare against your numeric target (see section 9 on the experiment template). You mark each action:
| Marker | Threshold |
|---|---|
| ✅ Succeeded | Exceeded the target |
| ⚠️ Promising | Within 10% of the target |
| ❌ Inconclusive | Below the target |
Stage 5: Decide. For each action, you decide:
| Decision | When you take it |
|---|---|
| Scale | It worked, you industrialize |
| Iterate | It almost worked, you adjust and retry |
| Kill | It didn't work, you stop and you record the learning |
This decision is made coldly. Not "we keep it because we spent time on it". The effort already put in is not an argument. Only the result counts.
Stage 6: Identify Bottleneck. You go back to your AARRR-A from section 3. You re-status the stages. You identify the bottleneck (which may have changed, or not). You return to stage 1 with this new bottleneck in mind.
The concrete ritual: 2h on Tuesday morning
Here's what a weekly cycle that holds up looks like.
| Slot | Step | What happens in the slot |
|---|---|---|
| Tuesday 10:00 - 10:30 | Gather Ideas | Review of the 10 to 30 raw ideas, adding the week's ideas |
| Tuesday 10:30 - 11:00 | Prioritize | Joint ICE scoring, selection of 3 to 5 Quick Wins |
| Tuesday 11:00 - 11:30 | Study Results | Review of the previous cycle, Scale / Iterate / Kill decisions |
| Tuesday 11:30 - 12:00 | Identify Bottleneck | AARRR-A review, declaration of the bottleneck for the cycle now opening |
| Wednesday → Monday | Execute | Execution of the 3 to 5 actions, no additions mid-cycle |
You see that 2h a week (excluding execution) is enough to keep the ritual turning. That's less than what you put into a product meeting or a sales review. And yet most founders stop at "I have an idea, I do it". Without a ritual, the randomness counter takes over from strategy.
Self-discipline: don't break the cycle
Three traps to avoid.
Trap 1: skipping a week. You miss a Tuesday because of a client emergency, a trip, a meeting. You skip the week. The next cycle, you skip again. Three weeks later, the ritual is dead. Rule: if you miss your Tuesday 10:00, you do the ritual Wednesday 10:00. Not the following week.
Trap 2: over-adding actions mid-week. "Brilliant idea Thursday at noon, let's launch it right now." No. You note it in your Notion, it'll be scored at the next cycle. This discipline is what distinguishes a growth program from a string of emergencies in disguise.
Trap 3: lying to yourself about the results. "It's too early to conclude." If you set a numeric target in section 9, you compare against that target and you decide. No half-measures. The point is to make progress.
Adapting to different stages
The weekly ritual adapts to your stage.
0 to 6 months (early early): weekly ritual, 2h on Tuesday. The co-founder (if you have one) must be in the loop. You do 3-5 actions per cycle.
6 to 18 months (early team): ritual every 2 weeks, 3h. You include the first growth or marketing hire. You do 5-10 actions per cycle.
18 months and up: monthly ritual, 4h. Feedback meeting format. You include the whole team involved in the funnel. You do 10-20 actions per cycle, with a quarterly roadmap in parallel.
At every stage, you never drop the frequency below monthly. If you can't hold a monthly ritual, growth isn't a priority for you. And if growth isn't a priority, you know what needs to be prioritized.
The over-instrumentation trap
You'll be tempted to add tools. A Notion for ideas, a Linear for execution, a Mixpanel for results, a Google Sheet for ICE, a Slack channel for announcements. Six tools. You won't use any of them three months later.
The rule: one tool to start, two maximum. A Notion (or Google Doc) for ideas + ICE + results + bottleneck. A Google Sheet or Mixpanel for the metrics. When you feel you need a third, you wait another six months. You'll discover you didn't need it.
Your ritual, at the end of section 7
Your ritual, set on the calendar
- Weekly slotday + time
- Participantsyou alone, co-founder, team
- The single flywheel documentlink
- Actions per cycle3 to 5 at the start
- Date of the next cycle
- The ruledon't skip, don't over-add, don't lie to yourself
You have a ritual. Now you'll see why this ritual produces an effect far greater than the sum of its parts: it's the compounding effect, and it's the subject of section 8.
8. The compounding effect: why multi-stage beats acquisition alone
You have a weekly ritual. You do 3-5 actions per cycle. You may be wondering if it's worth it, compared to "I put everything on ads and see". This section will show you, math in hand, why compounding growth crushes acquisition-alone growth over 12 months.
It's the clearest justification for doing growth seriously rather than isolated marketing plays.
The setup: a simple e-commerce
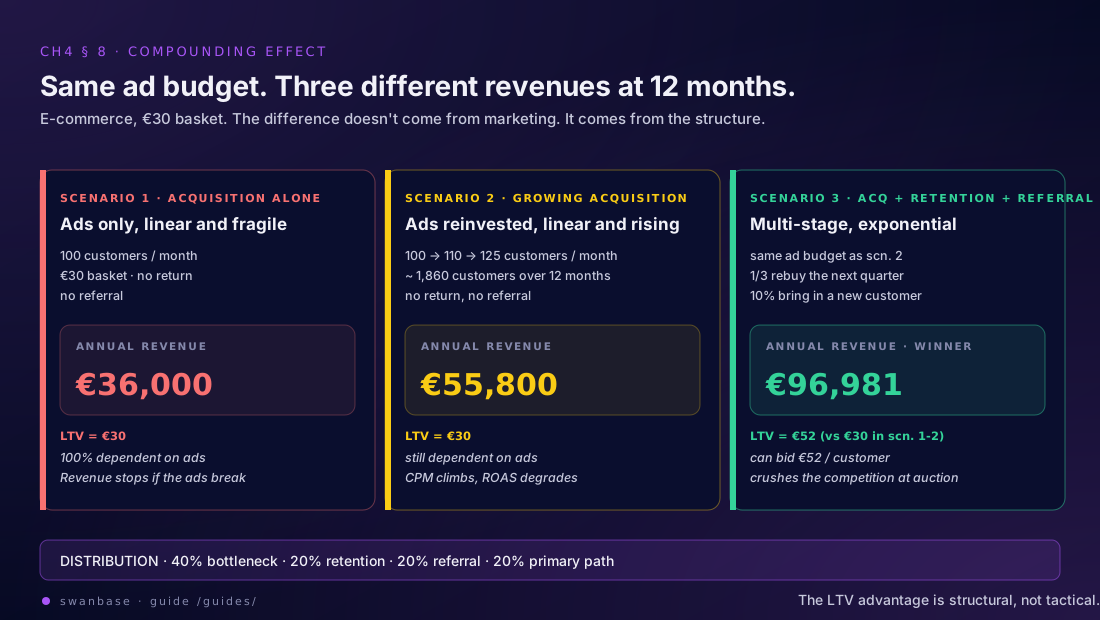
Imagine an e-commerce selling products at €30 on average. We'll look at three scenarios that all start at the same level, but structure their growth differently.
Scenario 1: acquisition alone (linear, fragile)
You put money into ads. You get 100 new customers a month, each spending €30. You have neither retention nor referral.
| Scenario 1 | Value |
|---|---|
| Monthly revenue | 100 customers × €30 = €3,000 |
| Annual revenue | €36,000 |
| LTV per customer | €30, one purchase then they leave |
| Risk | Total dependence on ads |
If your ads stop working (algorithm change, rising CPMs, creative fatigue), your revenue stops dead the following month. You have no customer stock that keeps buying.
Scenario 2: growing acquisition (linear but rising)
You reinvest 100% of the margin into more ads each month. You acquire 100 customers in M1, then 110 in M2, then 125 in M3, and so on. Linear growth, but increasing.
| Scenario 2 | Value |
|---|---|
| Customers over the year | ~1,860 |
| Annual revenue | ~€55,800 |
| LTV per customer | €30, still a single purchase |
| Risk | Still dependent on ads, with more volume |
It's better than scenario 1, but you stay dependent. And you pay a rising cost per customer as the auctions climb. Return on ad spend degrades.
Scenario 3: acquisition + retention + referral (exponential)
Same ad budget as scenario 2. But this time you activate two extra mechanisms.
- Retention: 1/3 of a quarter's customers rebuy the following quarter. You get there with automated email marketing + post-purchase content + product quality.
- Referral: 10% of new customers bring in a new customer within the month (word-of-mouth triggered by the product + a gifted offer).
You model this over 12 months. Here's what happens.
| Scenario 3 | Value |
|---|---|
| Customers over the year | ~1,860 acquired through ads, plus those brought in by retention and referral |
| Cumulative annual revenue | ~€96,981 |
| Effective LTV per ad-acquired customer | 96,981 / 1,860 = €52, against €30 in scenarios 1 and 2 |
You do nearly 2x the revenue of scenario 2 with the same ad budget. The delta comes from rebuys and word-of-mouth. And more importantly, your dependence on ads decreases: by M12, more than 50% of revenue comes from rebuys and referrals, not from new ad customers.
Why this gap widens over time
The compounding effect isn't linear, it's exponential. At each cycle:
- The previous month's customers rebuy, with no new acquisition cost.
- The previous month's customers bring in new customers, with no new acquisition cost.
- The average LTV rises, which lets you bid higher on ads.
The longer you wait, the wider the gap. Over 12 months, it's 2x. Over 24 months with durable retention, it can become 4x or 5x. Compound interest, applied to a customer base. The companies that truly scale never come out of pure paid.
The structural competitive advantage
Here's the most important consequence. With an LTV of €52 in scenario 3 versus €30 in scenario 1, you can now bid up to €52 in CAC on the ad platforms. Your competitors in scenario 1 can't go above €30. You crush them at auction.
| Who | Bid ceiling per customer |
|---|---|
| You, scenario 3 | €52 |
| Your competitor, scenario 1 | €30, beyond that they lose money |
You win the best placements, you show up first on premium queries, you attract the best creators for influence deals. You don't have a "either we scale ads or we do retention" strategy. You have both, and the second drives the first up.
This competitive advantage is structural. It can't be caught up by working harder. The competitor chasing you has to build their retention and referral machine first. And while they build it, you pull ahead.
The implication for your action list
Here's the practical rule that follows from all this: never put 100% of your actions on a single funnel stage.
You'll be tempted to put everything on acquisition because it seems the most urgent at the start. That's exactly scenario 1. Instead:
| Share of the cycle | Where it goes |
|---|---|
| 40% | Your bottleneck, at any stage |
| 20% | Retention, always, even outside the bottleneck |
| 20% | Referral, always, even outside the bottleneck |
| 20% | Your primary path from section 5 |
These percentages are indicative. The principle that doesn't move: you always put at least one action on retention and at least one on referral at every cycle, even if it's not your bottleneck. Because those are the only stages whose gains compound indefinitely.
The most widespread mistake
They put 80% of their effort on acquisition, 15% on activation, and 5% on retention. Referral isn't even in their top 10. After 12 months they're at €36,000 in revenue with a rising CAC. They tell themselves "marketing doesn't work". Marketing worked just fine. It was their growth architecture that was fragile.
The reverse isn't any better: putting everything on retention with no acquisition doesn't produce growth either. You have no one to retain. The sensible sequence is: acquisition first to get volume, retention and referral in parallel as soon as you have 50-100 customers to self-feed.
Your compounding, at the end of section 8
Where you stand on compounding
- My current scenario1, 2 or 3
- Share of my actions on retention%
- Share on referral%
- Current LTVestimated
- Current CACestimated
- LTV if I shift 2 actions to retention
You see why the weekly ritual from section 7 must include multi-stage actions. In section 9, we formalize how you document each of these actions: the experiment template.
9. Experiment template: Gas, OMTM, Objective, Result
You have a funnel, a bottleneck, prioritized ideas, a path, loops, a weekly ritual, and the compounding argument. The last missing piece is the format each action takes when you document it so you can learn from it. That's the experiment template.
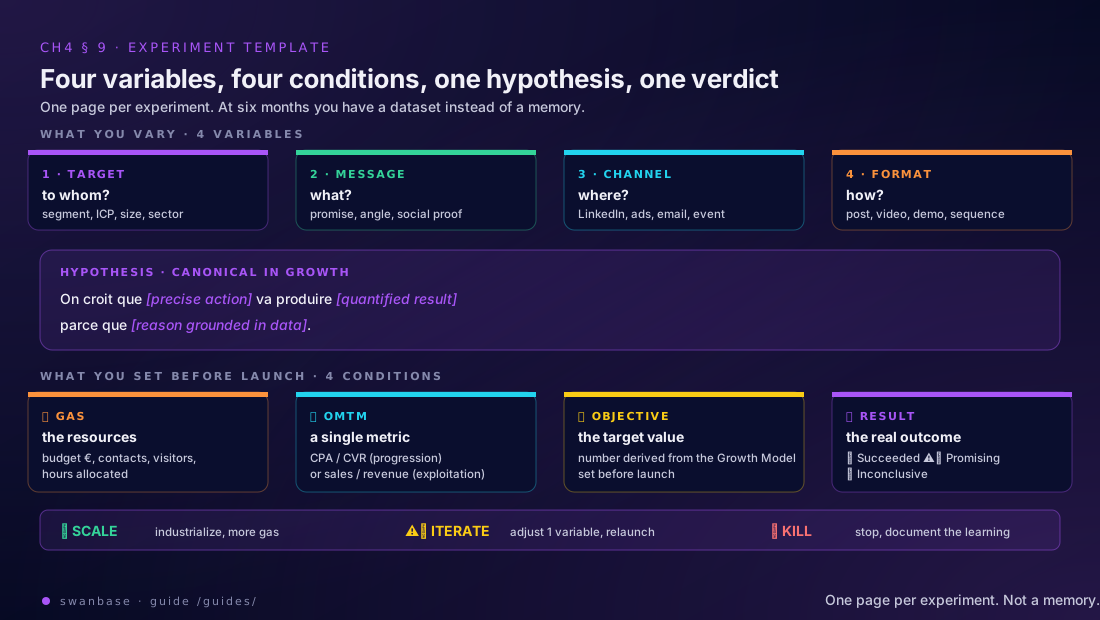
Without this template, you launch actions, get vague results, and don't know whether you learned anything. With it, each action becomes a short file that says who you're testing, what, where, how, how much you're putting in, what you're aiming for, and what you got. After 6 months, you have a folder of 30 documented experiments, and you can extract patterns.
The four variables you test
Every marketing experiment varies (at least) one of these four variables.
| Variable | The question |
|---|---|
| Target | To whom? |
| Message | What? |
| Channel | Where? |
| Format | How? |
Target and Message are variables of substance (the content). Channel and Format are variables of form (the container). Ideally you test only one variable at a time (otherwise you don't know which one produced the effect), but in practice, in the early stage, you often test two at a time to move faster. You accept being a little less rigorous on attribution in that case.
The four conditions of the experiment
Each experiment is defined by four conditions, set before launch.
⛽ Gas. The resources you devote to it. For ads, it's the budget. For emails, it's the number of contacts targeted. For a page, it's the number of visitors allotted to the test. The more gas you put in, the more statistically reliable your result, but the more resources you consume.
🏆 OMTM (One Metric That Matters). The single metric that will decide whether the experiment succeeded or failed. It's either a business metric (revenue, sales, leads) if you're in exploitation mode, or a marketing metric (CPA, CVR, CTR) if you're in progression mode. One only. If two metrics seem equal to you, you haven't decided yet what you want.
🎯 Objective. The numeric target value for the OMTM. You define it before launch, using your Growth Model from section 2 (you swap out one variable and see the impact). The objective isn't "it would be nice if...", it's a number you can compare to the result without argument.
🏹 Result. The actual outcome. You record it in three states:
| Marker | Threshold |
|---|---|
| ✅ Succeeded | Exceeds the objective |
| ⚠️ Promising | Within 10% of the objective |
| ❌ Inconclusive | Below the objective |
You update the Result each week during the experiment so you don't wait until the end to adjust.
The hypothesis format
Before launching an experiment, you write the hypothesis in this format:
The hypothesis format
We believe that[action]will produce[result]because[reasoning grounded in data]
This wording is canonical in growth. It forces three disciplines:
- You name the action precisely (not "improve the site", but "make the hero CTA orange").
- You name the expected result (not "more conversions", but "+15% CVR on landing X").
- You give a reason anchored in data (not "I think that", but "because the heatmap shows users don't see the current CTA").
Without a hypothesis, you're playing knock-'em-down. With a hypothesis, you're doing science.
A complete example, from brief to result
Here's what a documented experiment looks like, ready to copy-paste.
Experiment · 10 Instagram micro-influencer placements
We believe that10 placements with micro-influencers of 50 to 200k followerswill produce750 salesbecausethe story + post format converted above 0.5% on the 3 placements tested before
- TargetWomen 20-35, sensitive to ecology, conscious of image and social status
- MessageZero-waste cosmetics, made in France, as effective as industrial ones and 11× less polluting
- ChannelTier 1 Instagram influencers, 50k to 200k
- FormatStory + post over 7 days
- ⛽ Gas€35,000 in total, €3,500 per placement on average
- 🏆 OMTMNumber of sales
- 🎯 Objective750 sales over 30 days
- 📅 PeriodApril 7 → May 7
- W1 · D0-D7165 sales, 22% of the objective
- W2 · D7-D14410 sales, 55%
- W3 · D14-D21590 sales, 79%
- W4 · D21-D30738 sales, 98%
🏹 Result: ⚠️ Promising, 738 sales, 12 short. Decision: Iterate. Learning: micro-influencer placements work, we test a tier 1 / tier 2 mix in the next cycle.
The document fits on one page. You can copy-paste it for your own experiment.
The OMTM taxonomy: rates vs volumes
To choose your OMTM, ask whether you're in progression mode (I'm improving efficiency) or exploitation mode (I'm increasing volume).
| Mode | Metrics | When you use them |
|---|---|---|
| Progression, the rates (causes) | CPA, CAC, CVR, CTR, activation rate, signup rate | When you optimize the machine |
| Exploitation, the volumes (consequences) | Revenue, sales, leads, customers, LTV | When you scale the machine |
In the early stage, you'll alternate. One experiment in two will be progression (you optimize the landing's CVR, an ad campaign's CTR). The other one in two will be exploitation (you aim for 50 leads this month, 750 sales this quarter). The classic mistake is to always optimize rates without ever looking at volumes, or the reverse. You do both, in parallel.
The Three Results: Scale, Iterate, Kill
At the end of the experiment, you decide what to do.
✅ Succeeded → Scale. You exceeded the objective. You industrialize it. You put in more gas. You run it again on a cycle. You build the process around it.
⚠️ Promising → Iterate. You're within 10% of the objective. You adjust one variable (target, message, channel, format) and relaunch. You don't give up, but you don't industrialize either.
❌ Inconclusive → Kill. You're below the objective. You stop. You document the learning. You don't redo it in 3 months "just to see": if you haven't changed your hypothesis, you'll get the same result.
The Kill discipline is the hardest. Most founders keep dead experiments on life support because they invested time. That's the sunk cost. The weekly ritual from section 7 + the Scale/Iterate/Kill decision from section 9 is what protects you from that trap.
The experiment archive at 6 months
After 6 months of the ritual, you've documented 50-80 experiments (at 2-5 per weekly cycle). You take a half-day and do a review.
For each experiment, you re-tag:
One line per archived experiment
- AARRR-A stage
- Variable testedTarget / Message / Channel / Format
- Final verdictScale / Iterate / Kill
- Learningone line
You get a dataset. You see which variables produce the most Scales, which stages resist you most, which learnings repeat. This meta-analysis exercise is easily worth the 6 months of ritual.
Takeaways from chapter 4
Takeaways from CH4
- Experiment template adoptedyes / no
- Archive documentlink
- First experiment documentedtitle
- Date of the next weekly ritual
- Date of the 6-month reviewM+6
CH4 conclusion
You have the nine pieces: an NSM that decides, a Growth Model that simulates, a diagnosed funnel, a prioritization method, a chosen growth path, an activated loop, a weekly ritual, an argument for multi-stage, an experiment template.
It's a machine. It runs without you in day-to-day execution (because you documented it), and it compounds its gains over time (because you accumulate across several stages). At this point, you're no longer in the survival of CH1 or the artisanal selling of CH2. You're not even in the tactical marketing of CH3. You're building a system.
The system can run for years without changing shape. What will change is the team that runs it (you alone first, then with a hire, then with a team), and the stage at which you adapt the thresholds (50 customers, 500 customers, 5,000 customers aren't managed with the same ICE).
This guide ends here. Not because there's nothing left to say, but because from here on, it's your practice that speaks. The machine is in place. It's yours to run.
CH4. Your engine repeats and compounds
You're no longer "doing marketing". You have a number that decides, every week, what you do. You have stages with statuses, ideas scored in ICE, loops that feed your input. You've replaced "what do we try this week?" with "where's our bottleneck and what do we try on it?".
It's the last step of the guide. You're leaving opportunism behind. You're entering the systematic.
The end-of-chapter artifact
By the end of this chapter, you should have:
- A North Star Metric, explicit. A cause, not a consequence. You can write it on the board in five words.
- A Growth Model: your funnel × rates equation laid out. You know which variable to move to gain how much.
- A diagnosed AARRR-A: six stages with color statuses, the bottleneck identified, and the conviction to work on it before the rest.
- An ICE backlog fed every week. 10 to 30 raw ideas, scored, and 3 to 5 launched per cycle.
- A primary growth path chosen among virality, sticky and paid. A single one, defended, not three at 30%.
- An active growth loop. Referral, viral content, embedded virality, platform virality or cross-platform. A loop that turns the output into the input.
- A ritualized weekly Flywheel. Tuesday morning, two hours, six steps (gather, prioritize, execute, measure, decide, re-diagnose).
- A multi-stage effort distribution: not 80% on acquisition. Your attention spread across acquisition, activation, retention and referral according to what your model says.
- Experiment templates: one page per test, four variables, four conditions, a written hypothesis, a verdict.
If you check these nine boxes, you have an engine. An engine is a thing that produces revenue while you work on the next level.
Two weeks of tracking, zero experiments
You'll be tempted to measure everything. You'll install Amplitude, GA4, Hotjar, Mixpanel, and spend two weeks wiring up events. Meanwhile, you'll have launched zero new experiments.
The engine runs on three or four well-chosen numbers, not on a dashboard of forty widgets. The discipline of the weekly Flywheel always beats perfect instrumentation. If you can't say in two sentences "here's our bottleneck and here's what we're trying on it Tuesday", you have too many metrics and not enough experiments.
After the guide
The guide stops here because what comes next is no longer framework, it's execution. You'll repeat the Flywheel fifty times. You'll kill ideas that seemed brilliant. You'll watch a channel explode, then cool off, and another one pick up the slack. You'll have quarters where nothing moves, and a month where everything compounds at once.
That's normal. Compounding does its work in silence for a long time.
At this point, what you're missing is no longer method. It's duration. And conversation with other founders who've been through the same sequence.
That's exactly what we try to do at swanbase.